Immigrants from Guatemala vs Uruguayan GED/Equivalency
COMPARE
Immigrants from Guatemala
Uruguayan
GED/Equivalency
GED/Equivalency Comparison
Immigrants from Guatemala
Uruguayans
77.9%
GED/EQUIVALENCY
0.0/ 100
METRIC RATING
338th/ 347
METRIC RANK
85.0%
GED/EQUIVALENCY
16.0/ 100
METRIC RATING
200th/ 347
METRIC RANK
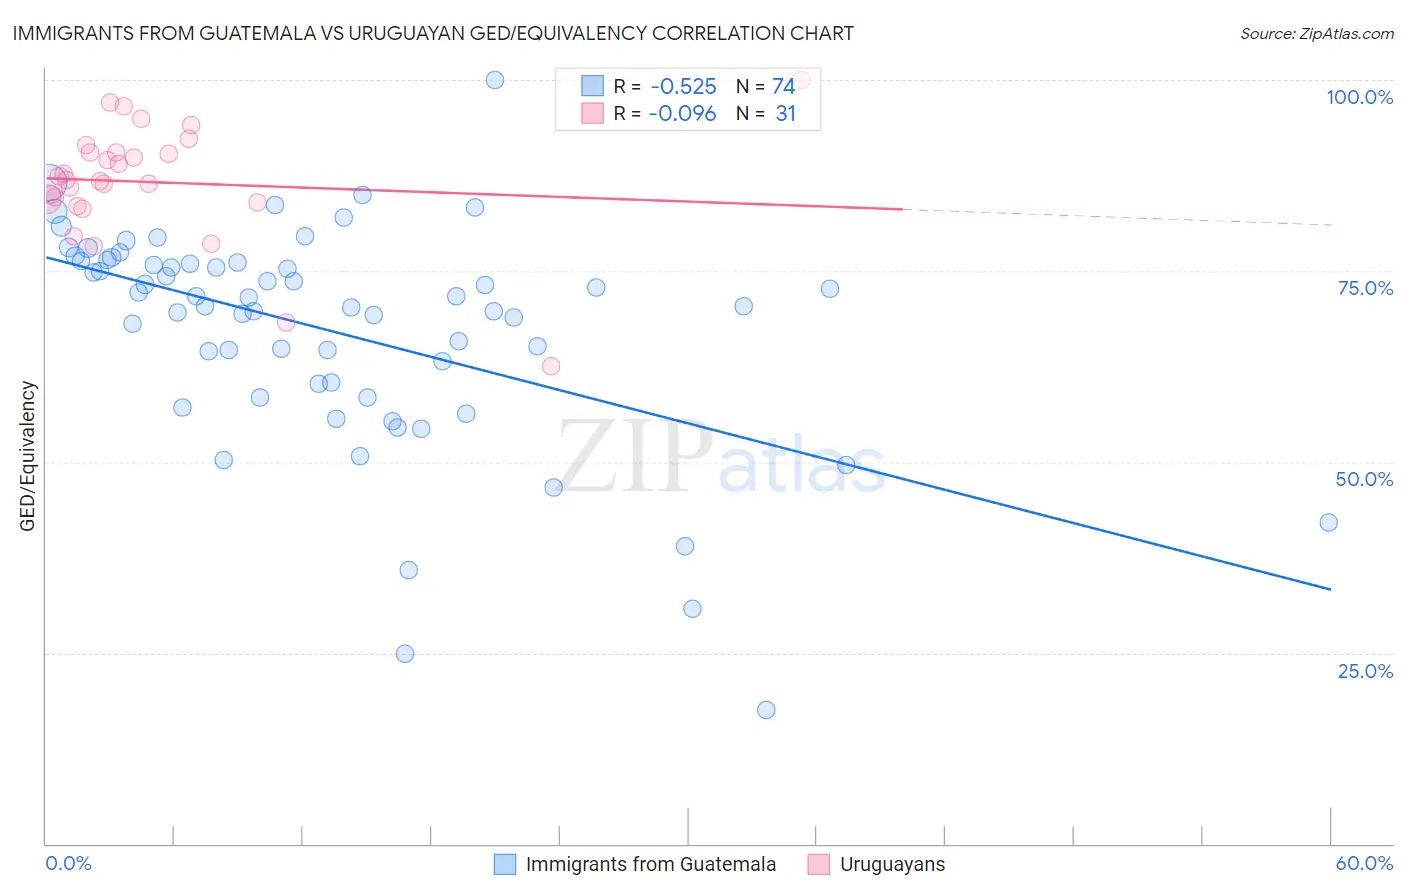
Immigrants from Guatemala vs Uruguayan GED/Equivalency Correlation Chart
The statistical analysis conducted on geographies consisting of 377,286,142 people shows a substantial negative correlation between the proportion of Immigrants from Guatemala and percentage of population with at least ged/equivalency education in the United States with a correlation coefficient (R) of -0.525 and weighted average of 77.9%. Similarly, the statistical analysis conducted on geographies consisting of 144,782,615 people shows a slight negative correlation between the proportion of Uruguayans and percentage of population with at least ged/equivalency education in the United States with a correlation coefficient (R) of -0.096 and weighted average of 85.0%, a difference of 9.1%.
GED/Equivalency Correlation Summary
| Measurement | Immigrants from Guatemala | Uruguayan |
| Minimum | 17.4% | 62.5% |
| Maximum | 100.0% | 100.0% |
| Range | 82.6% | 37.5% |
| Mean | 67.2% | 86.6% |
| Median | 71.0% | 86.9% |
| Interquartile 25% (IQ1) | 60.2% | 83.9% |
| Interquartile 75% (IQ3) | 76.1% | 90.5% |
| Interquartile Range (IQR) | 15.9% | 6.7% |
| Standard Deviation (Sample) | 14.6% | 7.7% |
| Standard Deviation (Population) | 14.5% | 7.6% |
Similar Demographics by GED/Equivalency
Demographics Similar to Immigrants from Guatemala by GED/Equivalency
In terms of ged/equivalency, the demographic groups most similar to Immigrants from Guatemala are Immigrants from Yemen (77.9%, a difference of 0.020%), Immigrants from Dominican Republic (78.0%, a difference of 0.090%), Immigrants from El Salvador (77.6%, a difference of 0.38%), Tohono O'odham (77.5%, a difference of 0.54%), and Mexican (77.4%, a difference of 0.63%).
| Demographics | Rating | Rank | GED/Equivalency |
| Immigrants | Honduras | 0.0 /100 | #331 | Tragic 78.7% |
| Immigrants | Azores | 0.0 /100 | #332 | Tragic 78.7% |
| Salvadorans | 0.0 /100 | #333 | Tragic 78.6% |
| Guatemalans | 0.0 /100 | #334 | Tragic 78.5% |
| Immigrants | Latin America | 0.0 /100 | #335 | Tragic 78.5% |
| Immigrants | Dominican Republic | 0.0 /100 | #336 | Tragic 78.0% |
| Immigrants | Yemen | 0.0 /100 | #337 | Tragic 77.9% |
| Immigrants | Guatemala | 0.0 /100 | #338 | Tragic 77.9% |
| Immigrants | El Salvador | 0.0 /100 | #339 | Tragic 77.6% |
| Tohono O'odham | 0.0 /100 | #340 | Tragic 77.5% |
| Mexicans | 0.0 /100 | #341 | Tragic 77.4% |
| Pima | 0.0 /100 | #342 | Tragic 76.4% |
| Immigrants | Central America | 0.0 /100 | #343 | Tragic 76.4% |
| Spanish American Indians | 0.0 /100 | #344 | Tragic 76.3% |
| Immigrants | Mexico | 0.0 /100 | #345 | Tragic 75.7% |
Demographics Similar to Uruguayans by GED/Equivalency
In terms of ged/equivalency, the demographic groups most similar to Uruguayans are Portuguese (85.0%, a difference of 0.0%), Somali (85.0%, a difference of 0.010%), Cree (85.0%, a difference of 0.010%), Panamanian (85.0%, a difference of 0.030%), and Hawaiian (85.0%, a difference of 0.030%).
| Demographics | Rating | Rank | GED/Equivalency |
| Delaware | 22.2 /100 | #193 | Fair 85.2% |
| Puget Sound Salish | 20.8 /100 | #194 | Fair 85.2% |
| Chippewa | 20.8 /100 | #195 | Fair 85.2% |
| Tongans | 20.7 /100 | #196 | Fair 85.2% |
| Costa Ricans | 20.4 /100 | #197 | Fair 85.2% |
| Immigrants | Africa | 17.5 /100 | #198 | Poor 85.1% |
| Somalis | 16.4 /100 | #199 | Poor 85.0% |
| Uruguayans | 16.0 /100 | #200 | Poor 85.0% |
| Portuguese | 15.9 /100 | #201 | Poor 85.0% |
| Cree | 15.9 /100 | #202 | Poor 85.0% |
| Panamanians | 15.3 /100 | #203 | Poor 85.0% |
| Hawaiians | 15.2 /100 | #204 | Poor 85.0% |
| Liberians | 14.6 /100 | #205 | Poor 85.0% |
| Samoans | 13.7 /100 | #206 | Poor 84.9% |
| Hmong | 13.1 /100 | #207 | Poor 84.9% |