Immigrants from Guyana vs Uruguayan 6th Grade
COMPARE
Immigrants from Guyana
Uruguayan
6th Grade
6th Grade Comparison
Immigrants from Guyana
Uruguayans
95.5%
6TH GRADE
0.0/ 100
METRIC RATING
312th/ 347
METRIC RANK
96.6%
6TH GRADE
2.5/ 100
METRIC RATING
234th/ 347
METRIC RANK
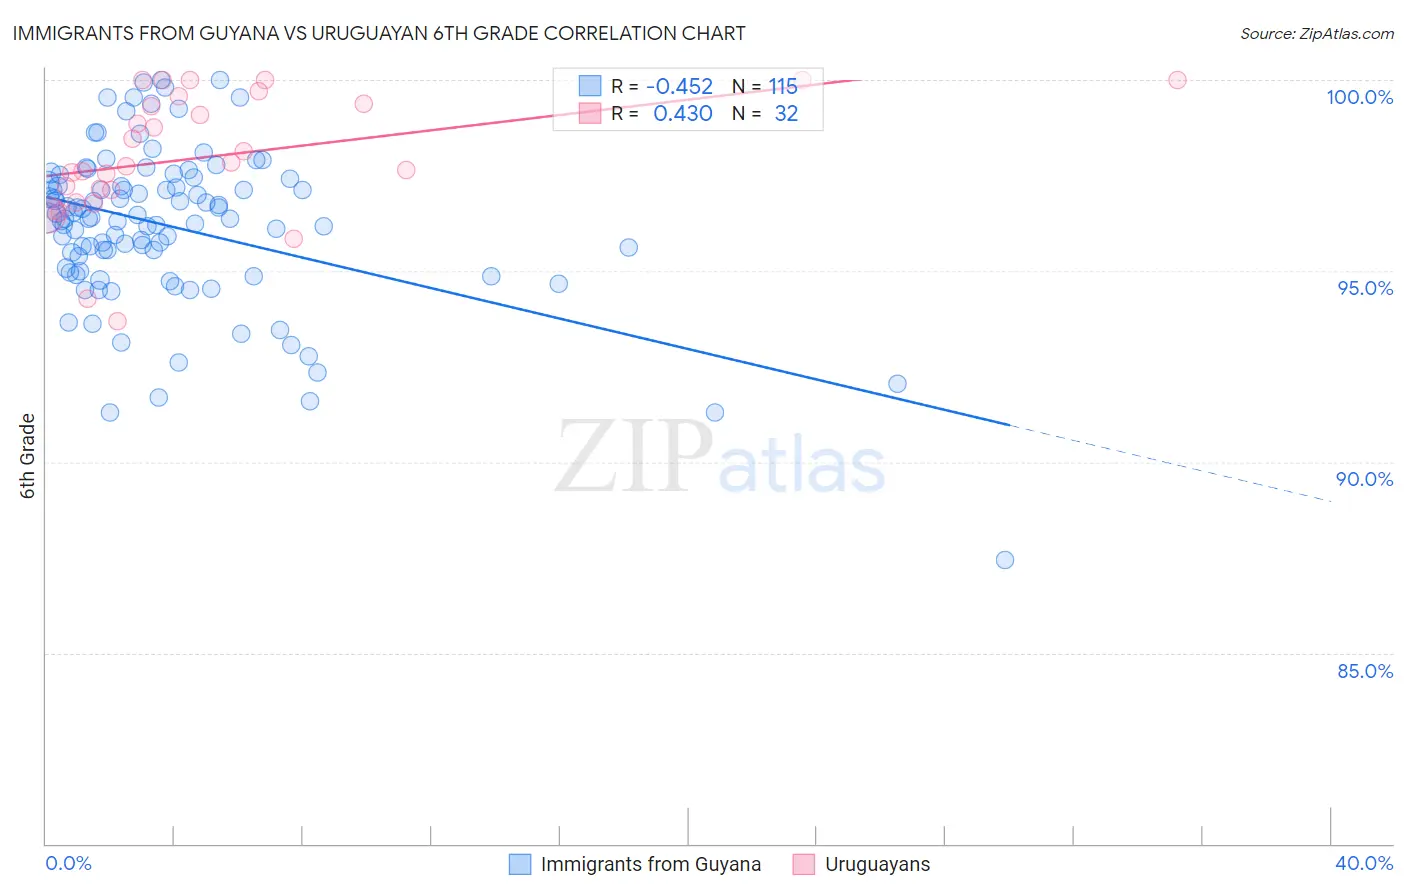
Immigrants from Guyana vs Uruguayan 6th Grade Correlation Chart
The statistical analysis conducted on geographies consisting of 183,673,461 people shows a moderate negative correlation between the proportion of Immigrants from Guyana and percentage of population with at least 6th grade education in the United States with a correlation coefficient (R) of -0.452 and weighted average of 95.5%. Similarly, the statistical analysis conducted on geographies consisting of 144,782,794 people shows a moderate positive correlation between the proportion of Uruguayans and percentage of population with at least 6th grade education in the United States with a correlation coefficient (R) of 0.430 and weighted average of 96.6%, a difference of 1.2%.
6th Grade Correlation Summary
| Measurement | Immigrants from Guyana | Uruguayan |
| Minimum | 87.4% | 93.7% |
| Maximum | 100.0% | 100.0% |
| Range | 12.6% | 6.3% |
| Mean | 96.2% | 98.0% |
| Median | 96.4% | 97.8% |
| Interquartile 25% (IQ1) | 95.0% | 97.0% |
| Interquartile 75% (IQ3) | 97.3% | 99.5% |
| Interquartile Range (IQR) | 2.3% | 2.5% |
| Standard Deviation (Sample) | 2.1% | 1.7% |
| Standard Deviation (Population) | 2.1% | 1.6% |
Similar Demographics by 6th Grade
Demographics Similar to Immigrants from Guyana by 6th Grade
In terms of 6th grade, the demographic groups most similar to Immigrants from Guyana are Immigrants from Portugal (95.5%, a difference of 0.010%), Ecuadorian (95.5%, a difference of 0.030%), Puerto Rican (95.5%, a difference of 0.040%), Immigrants from Caribbean (95.6%, a difference of 0.090%), and Nicaraguan (95.4%, a difference of 0.090%).
| Demographics | Rating | Rank | 6th Grade |
| Immigrants | Cuba | 0.0 /100 | #305 | Tragic 95.6% |
| Immigrants | Haiti | 0.0 /100 | #306 | Tragic 95.6% |
| Guyanese | 0.0 /100 | #307 | Tragic 95.6% |
| Immigrants | Caribbean | 0.0 /100 | #308 | Tragic 95.6% |
| Puerto Ricans | 0.0 /100 | #309 | Tragic 95.5% |
| Ecuadorians | 0.0 /100 | #310 | Tragic 95.5% |
| Immigrants | Portugal | 0.0 /100 | #311 | Tragic 95.5% |
| Immigrants | Guyana | 0.0 /100 | #312 | Tragic 95.5% |
| Nicaraguans | 0.0 /100 | #313 | Tragic 95.4% |
| Immigrants | Vietnam | 0.0 /100 | #314 | Tragic 95.4% |
| Immigrants | Bangladesh | 0.0 /100 | #315 | Tragic 95.4% |
| Japanese | 0.0 /100 | #316 | Tragic 95.4% |
| Vietnamese | 0.0 /100 | #317 | Tragic 95.3% |
| Belizeans | 0.0 /100 | #318 | Tragic 95.3% |
| Immigrants | Belize | 0.0 /100 | #319 | Tragic 95.3% |
Demographics Similar to Uruguayans by 6th Grade
In terms of 6th grade, the demographic groups most similar to Uruguayans are Asian (96.6%, a difference of 0.0%), Immigrants from Indonesia (96.6%, a difference of 0.010%), Immigrants from Eastern Africa (96.6%, a difference of 0.020%), Yuman (96.7%, a difference of 0.030%), and Nigerian (96.6%, a difference of 0.030%).
| Demographics | Rating | Rank | 6th Grade |
| Immigrants | Western Asia | 4.1 /100 | #227 | Tragic 96.7% |
| Immigrants | Malaysia | 4.0 /100 | #228 | Tragic 96.7% |
| Assyrians/Chaldeans/Syriacs | 4.0 /100 | #229 | Tragic 96.7% |
| Immigrants | Eastern Asia | 4.0 /100 | #230 | Tragic 96.7% |
| Sub-Saharan Africans | 3.5 /100 | #231 | Tragic 96.7% |
| South American Indians | 3.5 /100 | #232 | Tragic 96.7% |
| Yuman | 3.2 /100 | #233 | Tragic 96.7% |
| Uruguayans | 2.5 /100 | #234 | Tragic 96.6% |
| Asians | 2.4 /100 | #235 | Tragic 96.6% |
| Immigrants | Indonesia | 2.3 /100 | #236 | Tragic 96.6% |
| Immigrants | Eastern Africa | 2.0 /100 | #237 | Tragic 96.6% |
| Nigerians | 1.9 /100 | #238 | Tragic 96.6% |
| Indians (Asian) | 1.9 /100 | #239 | Tragic 96.6% |
| Koreans | 1.9 /100 | #240 | Tragic 96.6% |
| Senegalese | 1.8 /100 | #241 | Tragic 96.6% |