Immigrants from Guyana vs Immigrants from South Central Asia Associate's Degree
COMPARE
Immigrants from Guyana
Immigrants from South Central Asia
Associate's Degree
Associate's Degree Comparison
Immigrants from Guyana
Immigrants from South Central Asia
41.8%
ASSOCIATE'S DEGREE
0.5/ 100
METRIC RATING
255th/ 347
METRIC RANK
55.7%
ASSOCIATE'S DEGREE
100.0/ 100
METRIC RATING
12th/ 347
METRIC RANK
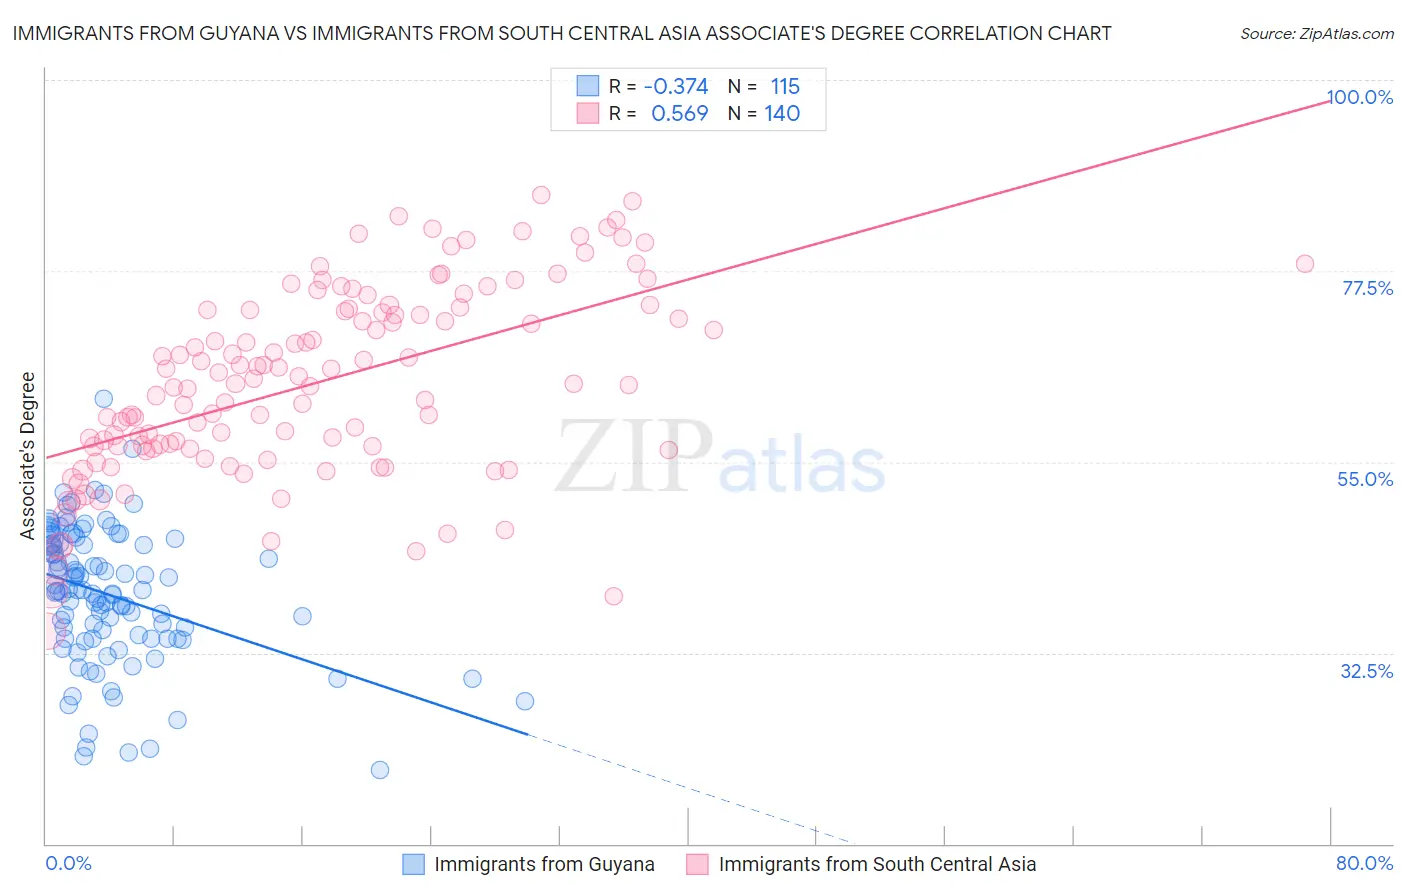
Immigrants from Guyana vs Immigrants from South Central Asia Associate's Degree Correlation Chart
The statistical analysis conducted on geographies consisting of 183,738,689 people shows a mild negative correlation between the proportion of Immigrants from Guyana and percentage of population with at least associate's degree education in the United States with a correlation coefficient (R) of -0.374 and weighted average of 41.8%. Similarly, the statistical analysis conducted on geographies consisting of 473,063,120 people shows a substantial positive correlation between the proportion of Immigrants from South Central Asia and percentage of population with at least associate's degree education in the United States with a correlation coefficient (R) of 0.569 and weighted average of 55.7%, a difference of 33.2%.
Associate's Degree Correlation Summary
| Measurement | Immigrants from Guyana | Immigrants from South Central Asia |
| Minimum | 18.6% | 35.1% |
| Maximum | 62.4% | 86.5% |
| Range | 43.8% | 51.4% |
| Mean | 39.3% | 64.4% |
| Median | 39.7% | 64.2% |
| Interquartile 25% (IQ1) | 34.1% | 56.7% |
| Interquartile 75% (IQ3) | 45.3% | 72.9% |
| Interquartile Range (IQR) | 11.2% | 16.2% |
| Standard Deviation (Sample) | 8.0% | 11.0% |
| Standard Deviation (Population) | 8.0% | 11.0% |
Similar Demographics by Associate's Degree
Demographics Similar to Immigrants from Guyana by Associate's Degree
In terms of associate's degree, the demographic groups most similar to Immigrants from Guyana are Cuban (41.9%, a difference of 0.090%), Immigrants from Congo (41.8%, a difference of 0.12%), Indonesian (41.9%, a difference of 0.15%), Spanish American (41.8%, a difference of 0.18%), and French American Indian (42.0%, a difference of 0.25%).
| Demographics | Rating | Rank | Associate's Degree |
| Immigrants | Ecuador | 0.8 /100 | #248 | Tragic 42.2% |
| Jamaicans | 0.7 /100 | #249 | Tragic 42.1% |
| U.S. Virgin Islanders | 0.7 /100 | #250 | Tragic 42.1% |
| Immigrants | Bahamas | 0.7 /100 | #251 | Tragic 42.1% |
| French American Indians | 0.6 /100 | #252 | Tragic 42.0% |
| Indonesians | 0.6 /100 | #253 | Tragic 41.9% |
| Cubans | 0.6 /100 | #254 | Tragic 41.9% |
| Immigrants | Guyana | 0.5 /100 | #255 | Tragic 41.8% |
| Immigrants | Congo | 0.5 /100 | #256 | Tragic 41.8% |
| Spanish Americans | 0.5 /100 | #257 | Tragic 41.8% |
| Japanese | 0.5 /100 | #258 | Tragic 41.7% |
| Malaysians | 0.4 /100 | #259 | Tragic 41.6% |
| Marshallese | 0.4 /100 | #260 | Tragic 41.6% |
| Nicaraguans | 0.4 /100 | #261 | Tragic 41.5% |
| Bahamians | 0.4 /100 | #262 | Tragic 41.5% |
Demographics Similar to Immigrants from South Central Asia by Associate's Degree
In terms of associate's degree, the demographic groups most similar to Immigrants from South Central Asia are Immigrants from Australia (55.8%, a difference of 0.12%), Immigrants from China (55.5%, a difference of 0.49%), Immigrants from Hong Kong (55.4%, a difference of 0.63%), Immigrants from Eastern Asia (55.4%, a difference of 0.67%), and Soviet Union (55.1%, a difference of 1.1%).
| Demographics | Rating | Rank | Associate's Degree |
| Iranians | 100.0 /100 | #5 | Exceptional 58.2% |
| Okinawans | 100.0 /100 | #6 | Exceptional 57.7% |
| Immigrants | Iran | 100.0 /100 | #7 | Exceptional 57.7% |
| Thais | 100.0 /100 | #8 | Exceptional 57.4% |
| Immigrants | Israel | 100.0 /100 | #9 | Exceptional 56.8% |
| Cypriots | 100.0 /100 | #10 | Exceptional 56.4% |
| Immigrants | Australia | 100.0 /100 | #11 | Exceptional 55.8% |
| Immigrants | South Central Asia | 100.0 /100 | #12 | Exceptional 55.7% |
| Immigrants | China | 100.0 /100 | #13 | Exceptional 55.5% |
| Immigrants | Hong Kong | 100.0 /100 | #14 | Exceptional 55.4% |
| Immigrants | Eastern Asia | 100.0 /100 | #15 | Exceptional 55.4% |
| Soviet Union | 100.0 /100 | #16 | Exceptional 55.1% |
| Eastern Europeans | 100.0 /100 | #17 | Exceptional 55.0% |
| Indians (Asian) | 100.0 /100 | #18 | Exceptional 54.8% |
| Immigrants | Ireland | 100.0 /100 | #19 | Exceptional 54.7% |