Immigrants from Guyana vs Alaska Native Associate's Degree
COMPARE
Immigrants from Guyana
Alaska Native
Associate's Degree
Associate's Degree Comparison
Immigrants from Guyana
Alaska Natives
41.8%
ASSOCIATE'S DEGREE
0.5/ 100
METRIC RATING
255th/ 347
METRIC RANK
37.5%
ASSOCIATE'S DEGREE
0.0/ 100
METRIC RATING
318th/ 347
METRIC RANK
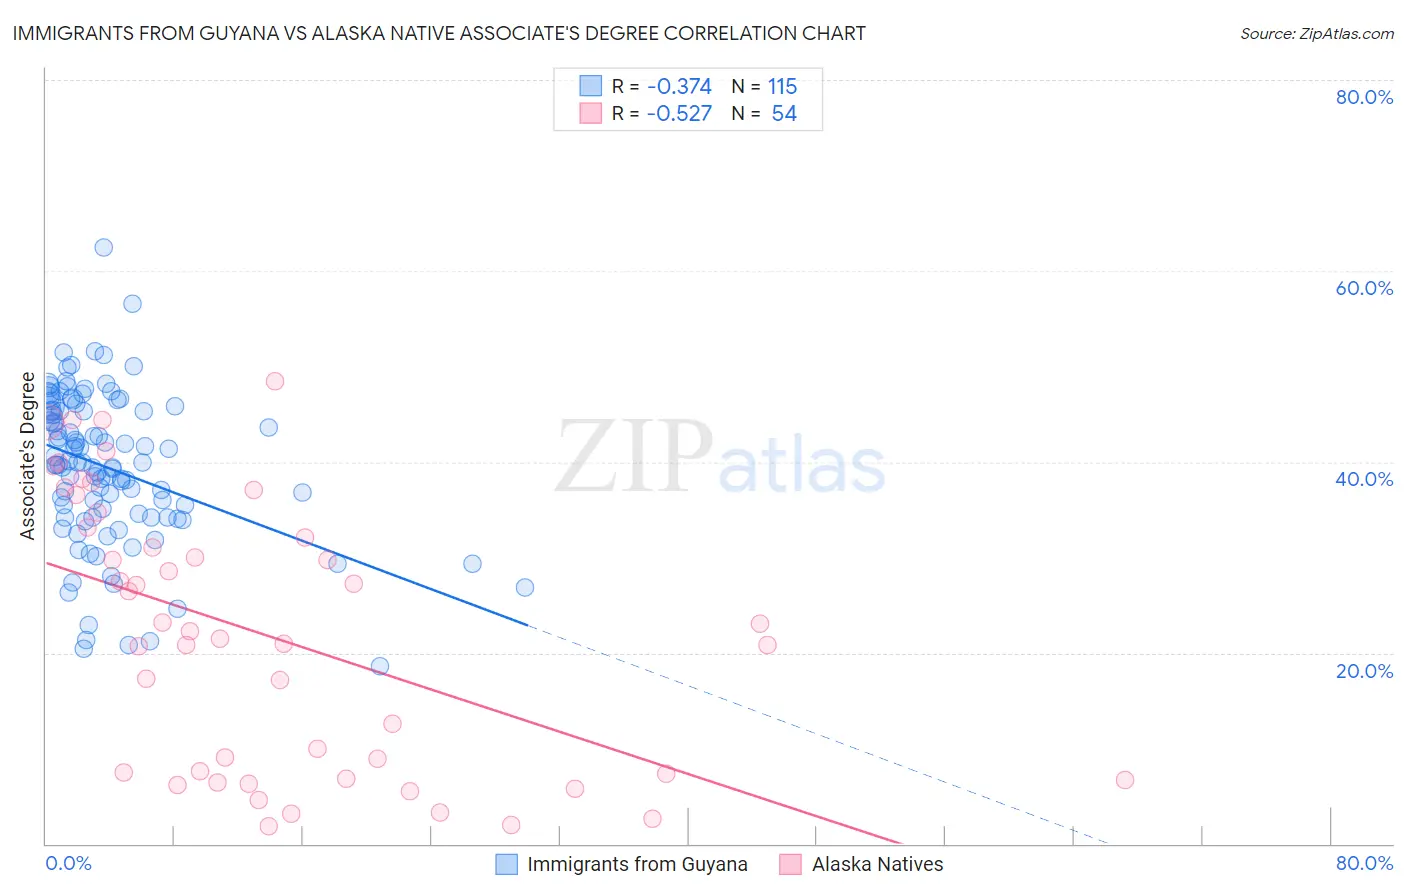
Immigrants from Guyana vs Alaska Native Associate's Degree Correlation Chart
The statistical analysis conducted on geographies consisting of 183,738,689 people shows a mild negative correlation between the proportion of Immigrants from Guyana and percentage of population with at least associate's degree education in the United States with a correlation coefficient (R) of -0.374 and weighted average of 41.8%. Similarly, the statistical analysis conducted on geographies consisting of 76,777,220 people shows a substantial negative correlation between the proportion of Alaska Natives and percentage of population with at least associate's degree education in the United States with a correlation coefficient (R) of -0.527 and weighted average of 37.5%, a difference of 11.7%.
Associate's Degree Correlation Summary
| Measurement | Immigrants from Guyana | Alaska Native |
| Minimum | 18.6% | 1.8% |
| Maximum | 62.4% | 48.5% |
| Range | 43.8% | 46.7% |
| Mean | 39.3% | 21.8% |
| Median | 39.7% | 21.9% |
| Interquartile 25% (IQ1) | 34.1% | 7.3% |
| Interquartile 75% (IQ3) | 45.3% | 33.2% |
| Interquartile Range (IQR) | 11.2% | 25.9% |
| Standard Deviation (Sample) | 8.0% | 14.0% |
| Standard Deviation (Population) | 8.0% | 13.9% |
Similar Demographics by Associate's Degree
Demographics Similar to Immigrants from Guyana by Associate's Degree
In terms of associate's degree, the demographic groups most similar to Immigrants from Guyana are Cuban (41.9%, a difference of 0.090%), Immigrants from Congo (41.8%, a difference of 0.12%), Indonesian (41.9%, a difference of 0.15%), Spanish American (41.8%, a difference of 0.18%), and French American Indian (42.0%, a difference of 0.25%).
| Demographics | Rating | Rank | Associate's Degree |
| Immigrants | Ecuador | 0.8 /100 | #248 | Tragic 42.2% |
| Jamaicans | 0.7 /100 | #249 | Tragic 42.1% |
| U.S. Virgin Islanders | 0.7 /100 | #250 | Tragic 42.1% |
| Immigrants | Bahamas | 0.7 /100 | #251 | Tragic 42.1% |
| French American Indians | 0.6 /100 | #252 | Tragic 42.0% |
| Indonesians | 0.6 /100 | #253 | Tragic 41.9% |
| Cubans | 0.6 /100 | #254 | Tragic 41.9% |
| Immigrants | Guyana | 0.5 /100 | #255 | Tragic 41.8% |
| Immigrants | Congo | 0.5 /100 | #256 | Tragic 41.8% |
| Spanish Americans | 0.5 /100 | #257 | Tragic 41.8% |
| Japanese | 0.5 /100 | #258 | Tragic 41.7% |
| Malaysians | 0.4 /100 | #259 | Tragic 41.6% |
| Marshallese | 0.4 /100 | #260 | Tragic 41.6% |
| Nicaraguans | 0.4 /100 | #261 | Tragic 41.5% |
| Bahamians | 0.4 /100 | #262 | Tragic 41.5% |
Demographics Similar to Alaska Natives by Associate's Degree
In terms of associate's degree, the demographic groups most similar to Alaska Natives are Fijian (37.4%, a difference of 0.22%), Yaqui (37.6%, a difference of 0.23%), Crow (37.6%, a difference of 0.25%), Cajun (37.4%, a difference of 0.25%), and Creek (37.6%, a difference of 0.26%).
| Demographics | Rating | Rank | Associate's Degree |
| Immigrants | Latin America | 0.0 /100 | #311 | Tragic 37.9% |
| Choctaw | 0.0 /100 | #312 | Tragic 37.8% |
| Hispanics or Latinos | 0.0 /100 | #313 | Tragic 37.7% |
| Seminole | 0.0 /100 | #314 | Tragic 37.7% |
| Creek | 0.0 /100 | #315 | Tragic 37.6% |
| Crow | 0.0 /100 | #316 | Tragic 37.6% |
| Yaqui | 0.0 /100 | #317 | Tragic 37.6% |
| Alaska Natives | 0.0 /100 | #318 | Tragic 37.5% |
| Fijians | 0.0 /100 | #319 | Tragic 37.4% |
| Cajuns | 0.0 /100 | #320 | Tragic 37.4% |
| Immigrants | Yemen | 0.0 /100 | #321 | Tragic 37.3% |
| Pennsylvania Germans | 0.0 /100 | #322 | Tragic 37.2% |
| Immigrants | Cabo Verde | 0.0 /100 | #323 | Tragic 36.8% |
| Arapaho | 0.0 /100 | #324 | Tragic 36.7% |
| Menominee | 0.0 /100 | #325 | Tragic 36.7% |