Immigrants from Guyana vs Italian Associate's Degree
COMPARE
Immigrants from Guyana
Italian
Associate's Degree
Associate's Degree Comparison
Immigrants from Guyana
Italians
41.8%
ASSOCIATE'S DEGREE
0.5/ 100
METRIC RATING
255th/ 347
METRIC RANK
48.7%
ASSOCIATE'S DEGREE
93.9/ 100
METRIC RATING
122nd/ 347
METRIC RANK
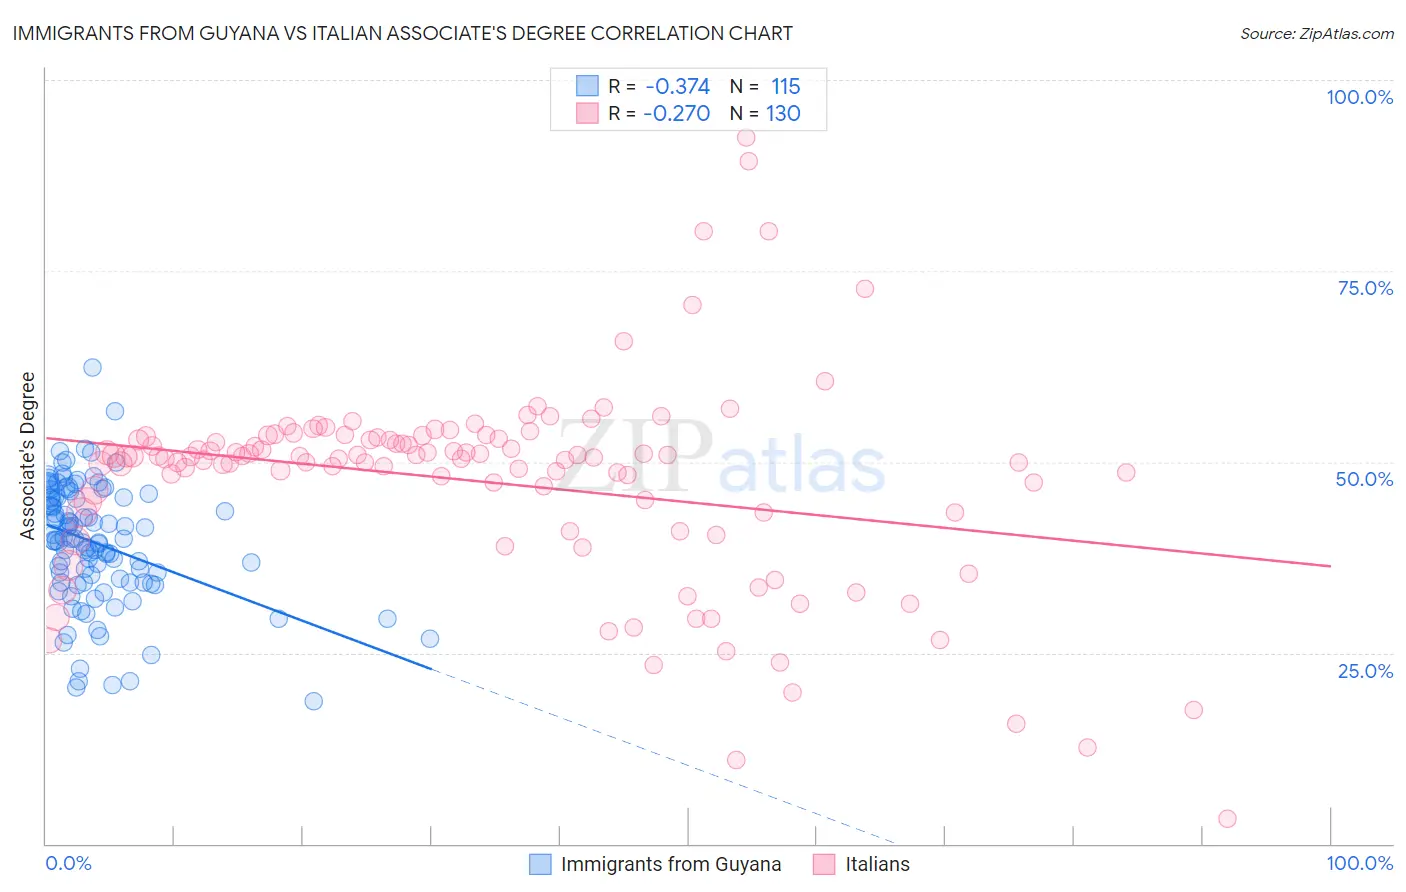
Immigrants from Guyana vs Italian Associate's Degree Correlation Chart
The statistical analysis conducted on geographies consisting of 183,738,689 people shows a mild negative correlation between the proportion of Immigrants from Guyana and percentage of population with at least associate's degree education in the United States with a correlation coefficient (R) of -0.374 and weighted average of 41.8%. Similarly, the statistical analysis conducted on geographies consisting of 575,016,726 people shows a weak negative correlation between the proportion of Italians and percentage of population with at least associate's degree education in the United States with a correlation coefficient (R) of -0.270 and weighted average of 48.7%, a difference of 16.4%.
Associate's Degree Correlation Summary
| Measurement | Immigrants from Guyana | Italian |
| Minimum | 18.6% | 3.2% |
| Maximum | 62.4% | 92.5% |
| Range | 43.8% | 89.3% |
| Mean | 39.3% | 47.4% |
| Median | 39.7% | 50.6% |
| Interquartile 25% (IQ1) | 34.1% | 43.4% |
| Interquartile 75% (IQ3) | 45.3% | 53.1% |
| Interquartile Range (IQR) | 11.2% | 9.7% |
| Standard Deviation (Sample) | 8.0% | 13.4% |
| Standard Deviation (Population) | 8.0% | 13.4% |
Similar Demographics by Associate's Degree
Demographics Similar to Immigrants from Guyana by Associate's Degree
In terms of associate's degree, the demographic groups most similar to Immigrants from Guyana are Cuban (41.9%, a difference of 0.090%), Immigrants from Congo (41.8%, a difference of 0.12%), Indonesian (41.9%, a difference of 0.15%), Spanish American (41.8%, a difference of 0.18%), and French American Indian (42.0%, a difference of 0.25%).
| Demographics | Rating | Rank | Associate's Degree |
| Immigrants | Ecuador | 0.8 /100 | #248 | Tragic 42.2% |
| Jamaicans | 0.7 /100 | #249 | Tragic 42.1% |
| U.S. Virgin Islanders | 0.7 /100 | #250 | Tragic 42.1% |
| Immigrants | Bahamas | 0.7 /100 | #251 | Tragic 42.1% |
| French American Indians | 0.6 /100 | #252 | Tragic 42.0% |
| Indonesians | 0.6 /100 | #253 | Tragic 41.9% |
| Cubans | 0.6 /100 | #254 | Tragic 41.9% |
| Immigrants | Guyana | 0.5 /100 | #255 | Tragic 41.8% |
| Immigrants | Congo | 0.5 /100 | #256 | Tragic 41.8% |
| Spanish Americans | 0.5 /100 | #257 | Tragic 41.8% |
| Japanese | 0.5 /100 | #258 | Tragic 41.7% |
| Malaysians | 0.4 /100 | #259 | Tragic 41.6% |
| Marshallese | 0.4 /100 | #260 | Tragic 41.6% |
| Nicaraguans | 0.4 /100 | #261 | Tragic 41.5% |
| Bahamians | 0.4 /100 | #262 | Tragic 41.5% |
Demographics Similar to Italians by Associate's Degree
In terms of associate's degree, the demographic groups most similar to Italians are Ugandan (48.7%, a difference of 0.0%), Brazilian (48.7%, a difference of 0.060%), Alsatian (48.8%, a difference of 0.23%), Lebanese (48.8%, a difference of 0.25%), and Albanian (48.8%, a difference of 0.26%).
| Demographics | Rating | Rank | Associate's Degree |
| Luxembourgers | 95.1 /100 | #115 | Exceptional 48.9% |
| British | 95.0 /100 | #116 | Exceptional 48.9% |
| Afghans | 94.8 /100 | #117 | Exceptional 48.9% |
| Albanians | 94.7 /100 | #118 | Exceptional 48.8% |
| Lebanese | 94.6 /100 | #119 | Exceptional 48.8% |
| Alsatians | 94.6 /100 | #120 | Exceptional 48.8% |
| Ugandans | 93.9 /100 | #121 | Exceptional 48.7% |
| Italians | 93.9 /100 | #122 | Exceptional 48.7% |
| Brazilians | 93.7 /100 | #123 | Exceptional 48.7% |
| Serbians | 92.6 /100 | #124 | Exceptional 48.5% |
| Chinese | 92.5 /100 | #125 | Exceptional 48.5% |
| Immigrants | Syria | 92.2 /100 | #126 | Exceptional 48.5% |
| Immigrants | Uganda | 92.1 /100 | #127 | Exceptional 48.5% |
| Immigrants | Eastern Africa | 91.6 /100 | #128 | Exceptional 48.4% |
| Swedes | 91.5 /100 | #129 | Exceptional 48.4% |