Thai vs Ugandan GED/Equivalency
COMPARE
Thai
Ugandan
GED/Equivalency
GED/Equivalency Comparison
Thais
Ugandans
89.1%
GED/EQUIVALENCY
100.0/ 100
METRIC RATING
6th/ 347
METRIC RANK
86.1%
GED/EQUIVALENCY
66.3/ 100
METRIC RATING
163rd/ 347
METRIC RANK
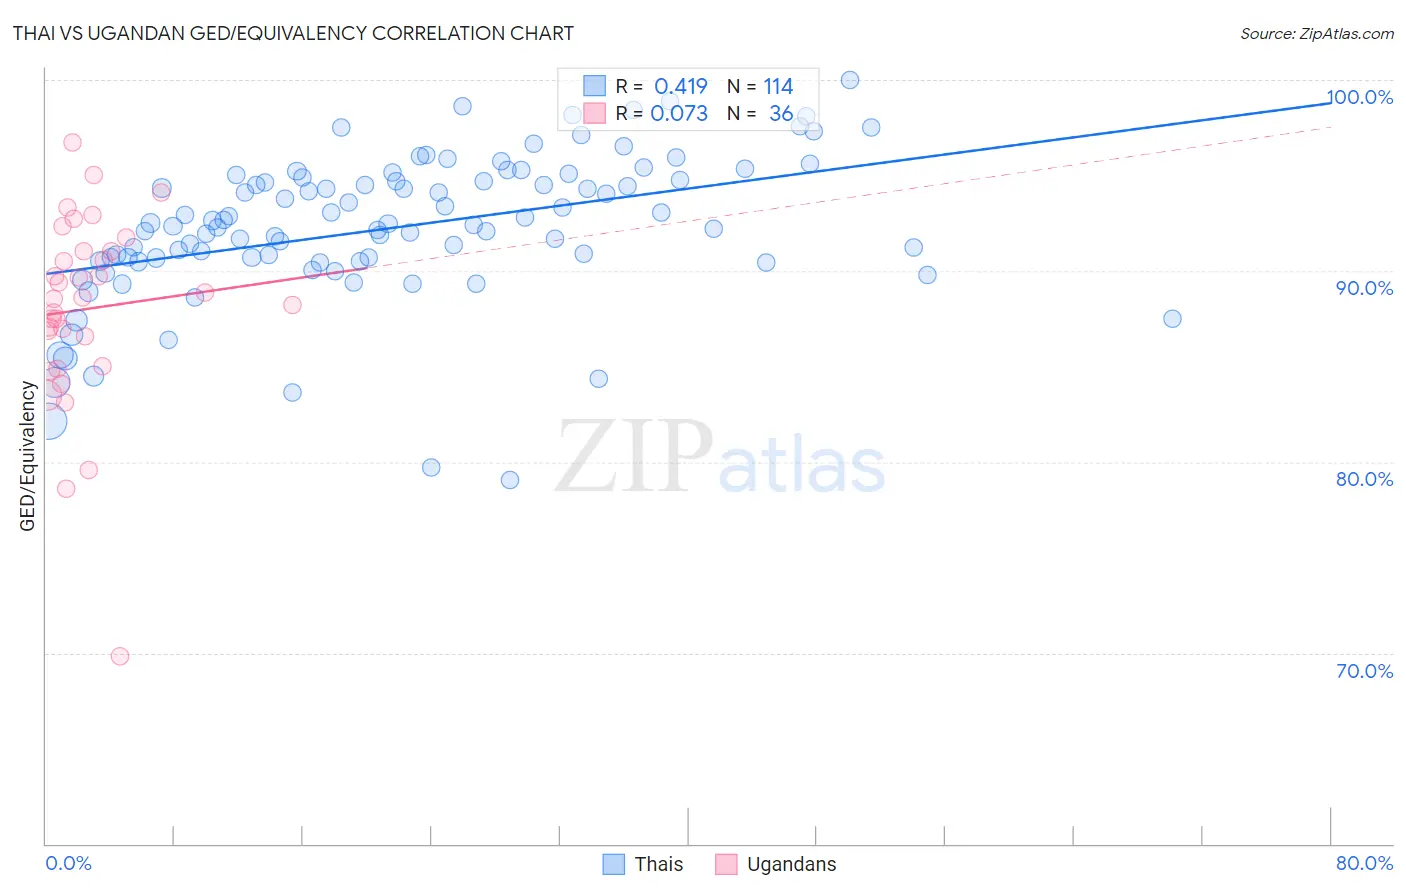
Thai vs Ugandan GED/Equivalency Correlation Chart
The statistical analysis conducted on geographies consisting of 475,814,962 people shows a moderate positive correlation between the proportion of Thais and percentage of population with at least ged/equivalency education in the United States with a correlation coefficient (R) of 0.419 and weighted average of 89.1%. Similarly, the statistical analysis conducted on geographies consisting of 94,018,260 people shows a slight positive correlation between the proportion of Ugandans and percentage of population with at least ged/equivalency education in the United States with a correlation coefficient (R) of 0.073 and weighted average of 86.1%, a difference of 3.6%.
GED/Equivalency Correlation Summary
| Measurement | Thai | Ugandan |
| Minimum | 79.0% | 69.8% |
| Maximum | 100.0% | 96.7% |
| Range | 21.0% | 26.9% |
| Mean | 92.3% | 88.0% |
| Median | 92.4% | 88.6% |
| Interquartile 25% (IQ1) | 90.5% | 85.8% |
| Interquartile 75% (IQ3) | 94.7% | 91.0% |
| Interquartile Range (IQR) | 4.2% | 5.2% |
| Standard Deviation (Sample) | 3.9% | 5.1% |
| Standard Deviation (Population) | 3.9% | 5.0% |
Similar Demographics by GED/Equivalency
Demographics Similar to Thais by GED/Equivalency
In terms of ged/equivalency, the demographic groups most similar to Thais are Latvian (89.2%, a difference of 0.020%), Eastern European (89.1%, a difference of 0.040%), Carpatho Rusyn (89.1%, a difference of 0.090%), Iranian (89.2%, a difference of 0.12%), and Chinese (89.0%, a difference of 0.12%).
| Demographics | Rating | Rank | GED/Equivalency |
| Immigrants | India | 100.0 /100 | #1 | Exceptional 89.7% |
| Filipinos | 100.0 /100 | #2 | Exceptional 89.5% |
| Immigrants | Singapore | 100.0 /100 | #3 | Exceptional 89.3% |
| Iranians | 100.0 /100 | #4 | Exceptional 89.2% |
| Latvians | 100.0 /100 | #5 | Exceptional 89.2% |
| Thais | 100.0 /100 | #6 | Exceptional 89.1% |
| Eastern Europeans | 99.9 /100 | #7 | Exceptional 89.1% |
| Carpatho Rusyns | 99.9 /100 | #8 | Exceptional 89.1% |
| Chinese | 99.9 /100 | #9 | Exceptional 89.0% |
| Norwegians | 99.9 /100 | #10 | Exceptional 89.0% |
| Bulgarians | 99.9 /100 | #11 | Exceptional 89.0% |
| Lithuanians | 99.9 /100 | #12 | Exceptional 88.9% |
| Immigrants | Iran | 99.9 /100 | #13 | Exceptional 88.9% |
| Cypriots | 99.9 /100 | #14 | Exceptional 88.9% |
| Okinawans | 99.9 /100 | #15 | Exceptional 88.9% |
Demographics Similar to Ugandans by GED/Equivalency
In terms of ged/equivalency, the demographic groups most similar to Ugandans are Venezuelan (86.0%, a difference of 0.020%), Immigrants from Iraq (86.1%, a difference of 0.040%), Alsatian (86.0%, a difference of 0.040%), Immigrants from Albania (86.0%, a difference of 0.050%), and Ethiopian (86.0%, a difference of 0.060%).
| Demographics | Rating | Rank | GED/Equivalency |
| Immigrants | Nepal | 73.3 /100 | #156 | Good 86.2% |
| Whites/Caucasians | 72.2 /100 | #157 | Good 86.2% |
| German Russians | 72.1 /100 | #158 | Good 86.2% |
| Immigrants | Kenya | 71.8 /100 | #159 | Good 86.2% |
| Immigrants | Morocco | 69.5 /100 | #160 | Good 86.1% |
| Immigrants | Syria | 69.3 /100 | #161 | Good 86.1% |
| Immigrants | Iraq | 68.1 /100 | #162 | Good 86.1% |
| Ugandans | 66.3 /100 | #163 | Good 86.1% |
| Venezuelans | 65.5 /100 | #164 | Good 86.0% |
| Alsatians | 64.3 /100 | #165 | Good 86.0% |
| Immigrants | Albania | 64.2 /100 | #166 | Good 86.0% |
| Ethiopians | 63.7 /100 | #167 | Good 86.0% |
| Sierra Leoneans | 61.8 /100 | #168 | Good 86.0% |
| Immigrants | Ethiopia | 61.2 /100 | #169 | Good 86.0% |
| Afghans | 59.7 /100 | #170 | Average 85.9% |