Immigrants from Grenada vs Yaqui College, Under 1 year
COMPARE
Immigrants from Grenada
Yaqui
College, Under 1 year
College, Under 1 year Comparison
Immigrants from Grenada
Yaqui
59.1%
COLLEGE, UNDER 1 YEAR
0.0/ 100
METRIC RATING
295th/ 347
METRIC RANK
60.2%
COLLEGE, UNDER 1 YEAR
0.1/ 100
METRIC RATING
278th/ 347
METRIC RANK
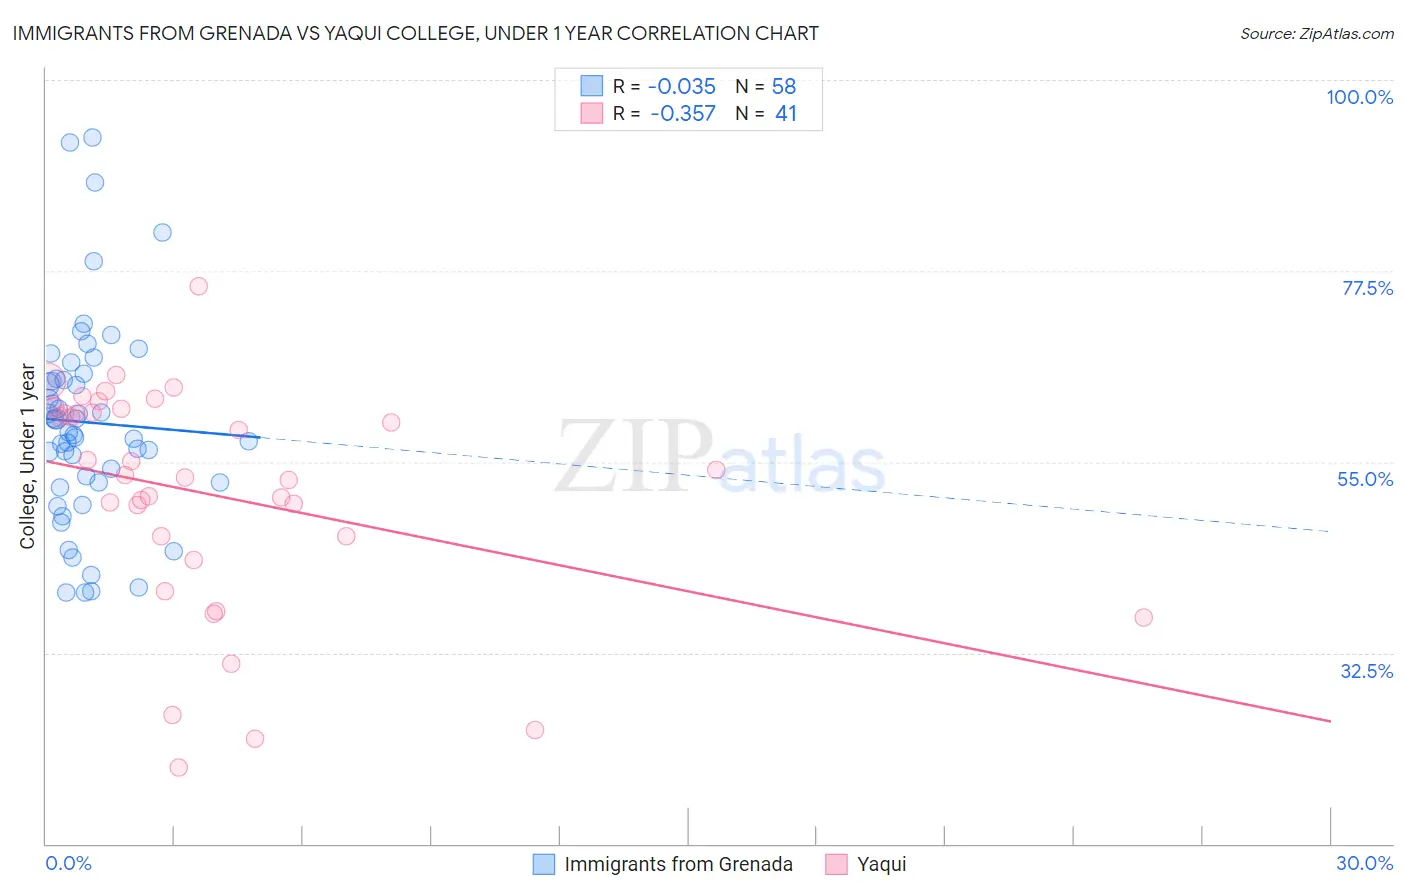
Immigrants from Grenada vs Yaqui College, Under 1 year Correlation Chart
The statistical analysis conducted on geographies consisting of 67,201,096 people shows no correlation between the proportion of Immigrants from Grenada and percentage of population with at least college, under 1 year education in the United States with a correlation coefficient (R) of -0.035 and weighted average of 59.1%. Similarly, the statistical analysis conducted on geographies consisting of 107,738,640 people shows a mild negative correlation between the proportion of Yaqui and percentage of population with at least college, under 1 year education in the United States with a correlation coefficient (R) of -0.357 and weighted average of 60.2%, a difference of 2.0%.
College, Under 1 year Correlation Summary
| Measurement | Immigrants from Grenada | Yaqui |
| Minimum | 39.6% | 19.0% |
| Maximum | 93.2% | 75.7% |
| Range | 53.6% | 56.6% |
| Mean | 59.7% | 51.2% |
| Median | 59.3% | 53.4% |
| Interquartile 25% (IQ1) | 52.6% | 44.8% |
| Interquartile 75% (IQ3) | 64.8% | 61.0% |
| Interquartile Range (IQR) | 12.2% | 16.2% |
| Standard Deviation (Sample) | 11.9% | 13.3% |
| Standard Deviation (Population) | 11.8% | 13.1% |
Demographics Similar to Immigrants from Grenada and Yaqui by College, Under 1 year
In terms of college, under 1 year, the demographic groups most similar to Immigrants from Grenada are Central American Indian (59.0%, a difference of 0.040%), Immigrants from Belize (59.1%, a difference of 0.10%), Seminole (59.1%, a difference of 0.12%), Nicaraguan (59.2%, a difference of 0.31%), and Creek (59.3%, a difference of 0.35%). Similarly, the demographic groups most similar to Yaqui are Ute (60.2%, a difference of 0.010%), Bahamian (60.3%, a difference of 0.030%), Crow (60.2%, a difference of 0.10%), Arapaho (60.3%, a difference of 0.17%), and Cherokee (60.1%, a difference of 0.21%).
| Demographics | Rating | Rank | College, Under 1 year |
| Arapaho | 0.1 /100 | #276 | Tragic 60.3% |
| Bahamians | 0.1 /100 | #277 | Tragic 60.3% |
| Yaqui | 0.1 /100 | #278 | Tragic 60.2% |
| Ute | 0.1 /100 | #279 | Tragic 60.2% |
| Crow | 0.1 /100 | #280 | Tragic 60.2% |
| Cherokee | 0.1 /100 | #281 | Tragic 60.1% |
| Belizeans | 0.1 /100 | #282 | Tragic 60.1% |
| Immigrants | Jamaica | 0.0 /100 | #283 | Tragic 59.7% |
| Immigrants | St. Vincent and the Grenadines | 0.0 /100 | #284 | Tragic 59.6% |
| Paiute | 0.0 /100 | #285 | Tragic 59.6% |
| British West Indians | 0.0 /100 | #286 | Tragic 59.5% |
| Sioux | 0.0 /100 | #287 | Tragic 59.4% |
| Blacks/African Americans | 0.0 /100 | #288 | Tragic 59.4% |
| Choctaw | 0.0 /100 | #289 | Tragic 59.3% |
| Ecuadorians | 0.0 /100 | #290 | Tragic 59.3% |
| Creek | 0.0 /100 | #291 | Tragic 59.3% |
| Nicaraguans | 0.0 /100 | #292 | Tragic 59.2% |
| Seminole | 0.0 /100 | #293 | Tragic 59.1% |
| Immigrants | Belize | 0.0 /100 | #294 | Tragic 59.1% |
| Immigrants | Grenada | 0.0 /100 | #295 | Tragic 59.1% |
| Central American Indians | 0.0 /100 | #296 | Tragic 59.0% |