Immigrants from Grenada vs Puerto Rican College, Under 1 year
COMPARE
Immigrants from Grenada
Puerto Rican
College, Under 1 year
College, Under 1 year Comparison
Immigrants from Grenada
Puerto Ricans
59.1%
COLLEGE, UNDER 1 YEAR
0.0/ 100
METRIC RATING
295th/ 347
METRIC RANK
56.8%
COLLEGE, UNDER 1 YEAR
0.0/ 100
METRIC RATING
319th/ 347
METRIC RANK
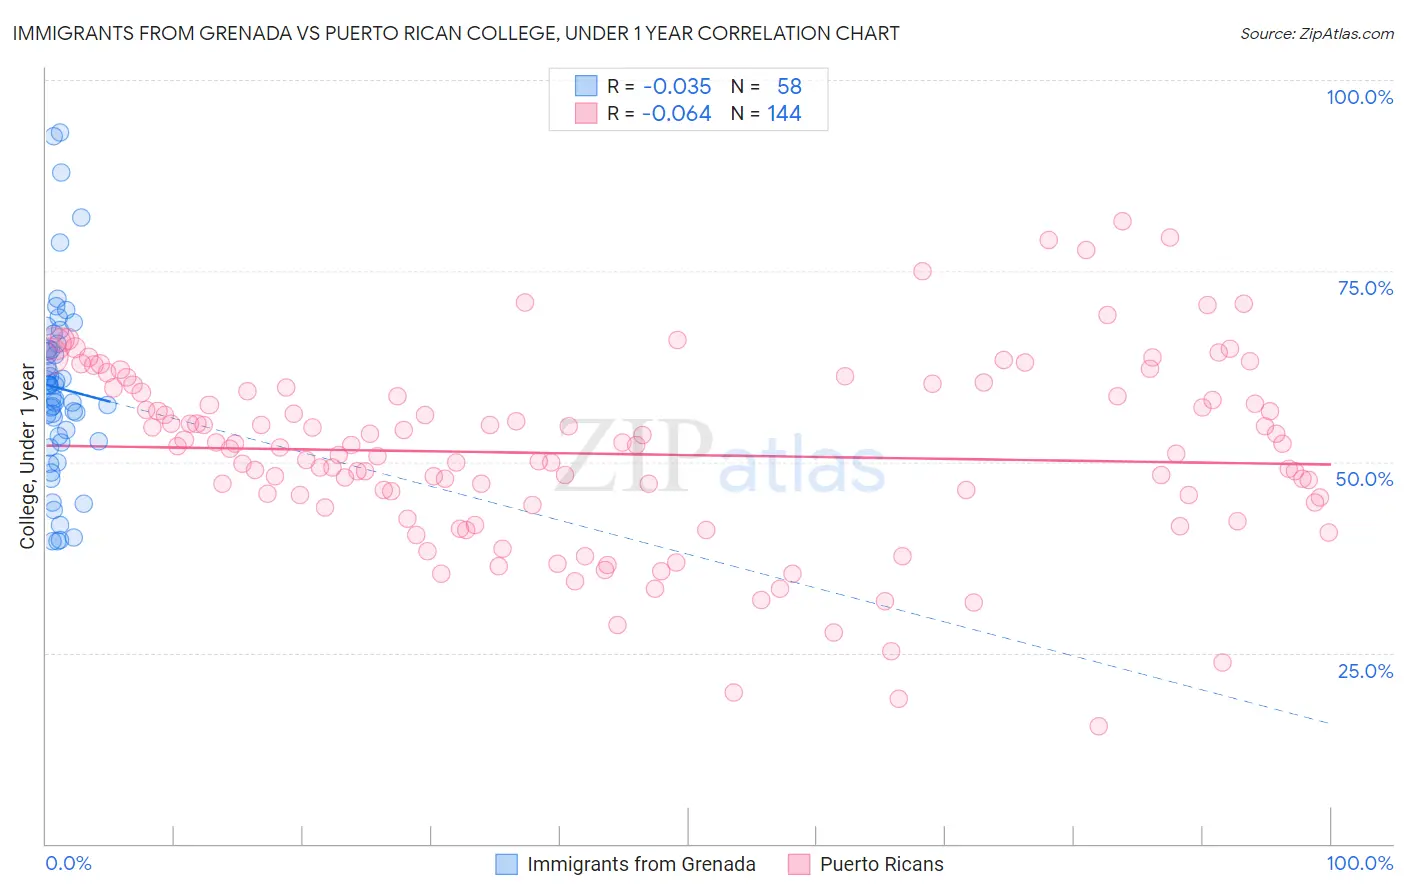
Immigrants from Grenada vs Puerto Rican College, Under 1 year Correlation Chart
The statistical analysis conducted on geographies consisting of 67,201,096 people shows no correlation between the proportion of Immigrants from Grenada and percentage of population with at least college, under 1 year education in the United States with a correlation coefficient (R) of -0.035 and weighted average of 59.1%. Similarly, the statistical analysis conducted on geographies consisting of 528,317,754 people shows a slight negative correlation between the proportion of Puerto Ricans and percentage of population with at least college, under 1 year education in the United States with a correlation coefficient (R) of -0.064 and weighted average of 56.8%, a difference of 3.9%.
College, Under 1 year Correlation Summary
| Measurement | Immigrants from Grenada | Puerto Rican |
| Minimum | 39.6% | 15.4% |
| Maximum | 93.2% | 81.5% |
| Range | 53.6% | 66.1% |
| Mean | 59.7% | 51.0% |
| Median | 59.3% | 52.0% |
| Interquartile 25% (IQ1) | 52.6% | 44.5% |
| Interquartile 75% (IQ3) | 64.8% | 59.2% |
| Interquartile Range (IQR) | 12.2% | 14.7% |
| Standard Deviation (Sample) | 11.9% | 12.2% |
| Standard Deviation (Population) | 11.8% | 12.2% |
Similar Demographics by College, Under 1 year
Demographics Similar to Immigrants from Grenada by College, Under 1 year
In terms of college, under 1 year, the demographic groups most similar to Immigrants from Grenada are Central American Indian (59.0%, a difference of 0.040%), Guyanese (59.0%, a difference of 0.080%), Immigrants from Belize (59.1%, a difference of 0.10%), Seminole (59.1%, a difference of 0.12%), and Nicaraguan (59.2%, a difference of 0.31%).
| Demographics | Rating | Rank | College, Under 1 year |
| Blacks/African Americans | 0.0 /100 | #288 | Tragic 59.4% |
| Choctaw | 0.0 /100 | #289 | Tragic 59.3% |
| Ecuadorians | 0.0 /100 | #290 | Tragic 59.3% |
| Creek | 0.0 /100 | #291 | Tragic 59.3% |
| Nicaraguans | 0.0 /100 | #292 | Tragic 59.2% |
| Seminole | 0.0 /100 | #293 | Tragic 59.1% |
| Immigrants | Belize | 0.0 /100 | #294 | Tragic 59.1% |
| Immigrants | Grenada | 0.0 /100 | #295 | Tragic 59.1% |
| Central American Indians | 0.0 /100 | #296 | Tragic 59.0% |
| Guyanese | 0.0 /100 | #297 | Tragic 59.0% |
| Immigrants | Ecuador | 0.0 /100 | #298 | Tragic 58.7% |
| Cubans | 0.0 /100 | #299 | Tragic 58.6% |
| Immigrants | Guyana | 0.0 /100 | #300 | Tragic 58.5% |
| Mexican American Indians | 0.0 /100 | #301 | Tragic 58.1% |
| Apache | 0.0 /100 | #302 | Tragic 58.0% |
Demographics Similar to Puerto Ricans by College, Under 1 year
In terms of college, under 1 year, the demographic groups most similar to Puerto Ricans are Guatemalan (56.8%, a difference of 0.060%), Immigrants from Haiti (56.9%, a difference of 0.20%), Hispanic or Latino (57.0%, a difference of 0.32%), Native/Alaskan (56.6%, a difference of 0.32%), and Menominee (57.0%, a difference of 0.36%).
| Demographics | Rating | Rank | College, Under 1 year |
| Salvadorans | 0.0 /100 | #312 | Tragic 57.3% |
| Dutch West Indians | 0.0 /100 | #313 | Tragic 57.2% |
| Hopi | 0.0 /100 | #314 | Tragic 57.1% |
| Hondurans | 0.0 /100 | #315 | Tragic 57.1% |
| Menominee | 0.0 /100 | #316 | Tragic 57.0% |
| Hispanics or Latinos | 0.0 /100 | #317 | Tragic 57.0% |
| Immigrants | Haiti | 0.0 /100 | #318 | Tragic 56.9% |
| Puerto Ricans | 0.0 /100 | #319 | Tragic 56.8% |
| Guatemalans | 0.0 /100 | #320 | Tragic 56.8% |
| Natives/Alaskans | 0.0 /100 | #321 | Tragic 56.6% |
| Immigrants | Caribbean | 0.0 /100 | #322 | Tragic 56.6% |
| Immigrants | Honduras | 0.0 /100 | #323 | Tragic 56.5% |
| Immigrants | El Salvador | 0.0 /100 | #324 | Tragic 56.4% |
| Immigrants | Latin America | 0.0 /100 | #325 | Tragic 56.3% |
| Navajo | 0.0 /100 | #326 | Tragic 56.3% |