Immigrants from Grenada vs Panamanian College, Under 1 year
COMPARE
Immigrants from Grenada
Panamanian
College, Under 1 year
College, Under 1 year Comparison
Immigrants from Grenada
Panamanians
59.1%
COLLEGE, UNDER 1 YEAR
0.0/ 100
METRIC RATING
295th/ 347
METRIC RANK
64.3%
COLLEGE, UNDER 1 YEAR
17.0/ 100
METRIC RATING
199th/ 347
METRIC RANK
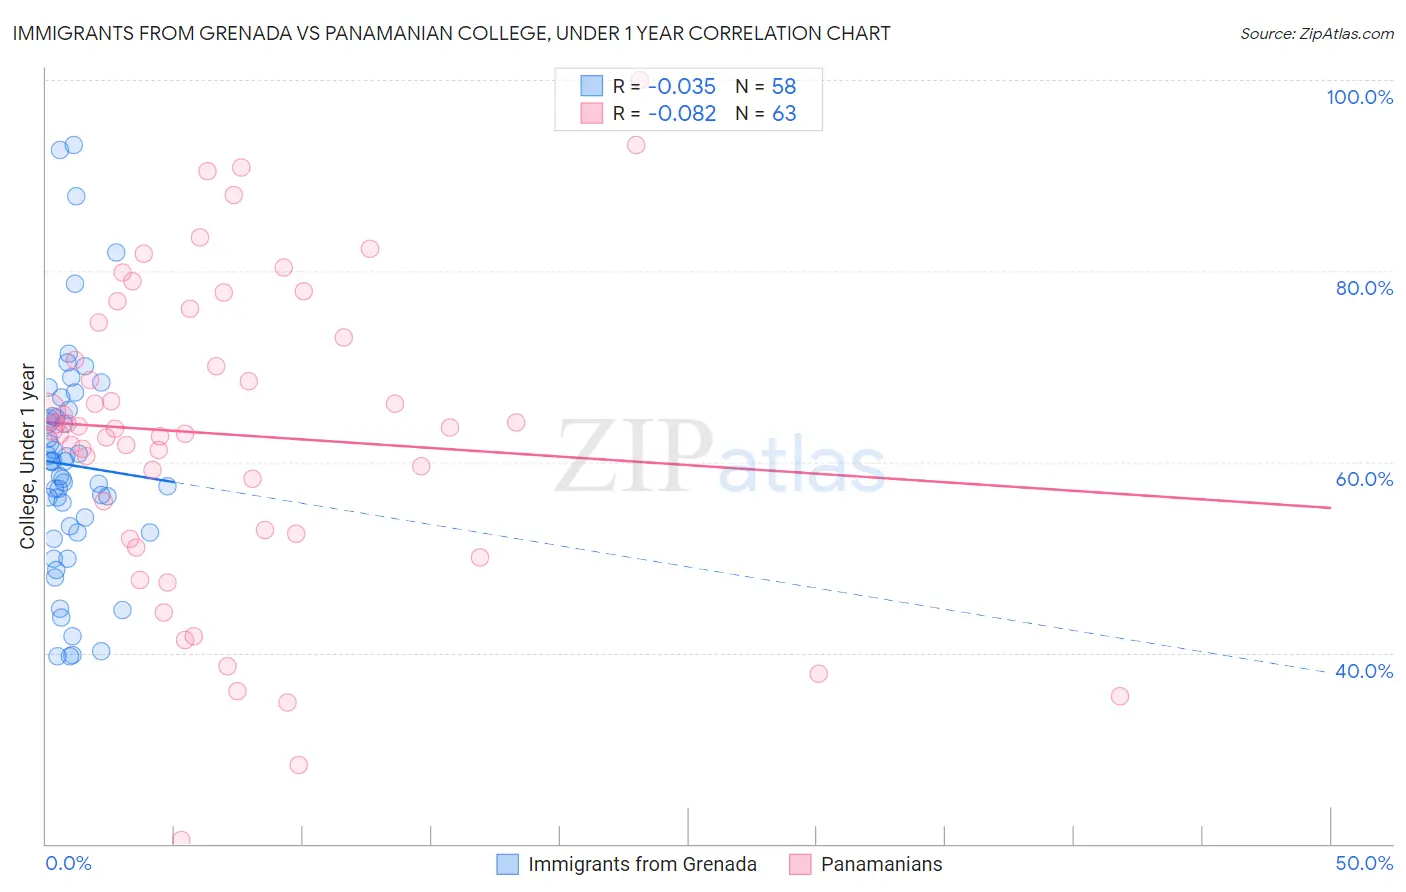
Immigrants from Grenada vs Panamanian College, Under 1 year Correlation Chart
The statistical analysis conducted on geographies consisting of 67,201,096 people shows no correlation between the proportion of Immigrants from Grenada and percentage of population with at least college, under 1 year education in the United States with a correlation coefficient (R) of -0.035 and weighted average of 59.1%. Similarly, the statistical analysis conducted on geographies consisting of 281,250,786 people shows a slight negative correlation between the proportion of Panamanians and percentage of population with at least college, under 1 year education in the United States with a correlation coefficient (R) of -0.082 and weighted average of 64.3%, a difference of 8.8%.
College, Under 1 year Correlation Summary
| Measurement | Immigrants from Grenada | Panamanian |
| Minimum | 39.6% | 20.4% |
| Maximum | 93.2% | 100.0% |
| Range | 53.6% | 79.6% |
| Mean | 59.7% | 62.9% |
| Median | 59.3% | 63.5% |
| Interquartile 25% (IQ1) | 52.6% | 52.5% |
| Interquartile 75% (IQ3) | 64.8% | 74.6% |
| Interquartile Range (IQR) | 12.2% | 22.0% |
| Standard Deviation (Sample) | 11.9% | 16.4% |
| Standard Deviation (Population) | 11.8% | 16.3% |
Similar Demographics by College, Under 1 year
Demographics Similar to Immigrants from Grenada by College, Under 1 year
In terms of college, under 1 year, the demographic groups most similar to Immigrants from Grenada are Central American Indian (59.0%, a difference of 0.040%), Guyanese (59.0%, a difference of 0.080%), Immigrants from Belize (59.1%, a difference of 0.10%), Seminole (59.1%, a difference of 0.12%), and Nicaraguan (59.2%, a difference of 0.31%).
| Demographics | Rating | Rank | College, Under 1 year |
| Blacks/African Americans | 0.0 /100 | #288 | Tragic 59.4% |
| Choctaw | 0.0 /100 | #289 | Tragic 59.3% |
| Ecuadorians | 0.0 /100 | #290 | Tragic 59.3% |
| Creek | 0.0 /100 | #291 | Tragic 59.3% |
| Nicaraguans | 0.0 /100 | #292 | Tragic 59.2% |
| Seminole | 0.0 /100 | #293 | Tragic 59.1% |
| Immigrants | Belize | 0.0 /100 | #294 | Tragic 59.1% |
| Immigrants | Grenada | 0.0 /100 | #295 | Tragic 59.1% |
| Central American Indians | 0.0 /100 | #296 | Tragic 59.0% |
| Guyanese | 0.0 /100 | #297 | Tragic 59.0% |
| Immigrants | Ecuador | 0.0 /100 | #298 | Tragic 58.7% |
| Cubans | 0.0 /100 | #299 | Tragic 58.6% |
| Immigrants | Guyana | 0.0 /100 | #300 | Tragic 58.5% |
| Mexican American Indians | 0.0 /100 | #301 | Tragic 58.1% |
| Apache | 0.0 /100 | #302 | Tragic 58.0% |
Demographics Similar to Panamanians by College, Under 1 year
In terms of college, under 1 year, the demographic groups most similar to Panamanians are Nigerian (64.3%, a difference of 0.020%), French Canadian (64.2%, a difference of 0.060%), Tsimshian (64.3%, a difference of 0.070%), South American (64.2%, a difference of 0.070%), and Uruguayan (64.2%, a difference of 0.11%).
| Demographics | Rating | Rank | College, Under 1 year |
| Immigrants | Thailand | 27.0 /100 | #192 | Fair 64.7% |
| Slovaks | 26.7 /100 | #193 | Fair 64.7% |
| Immigrants | Cameroon | 24.6 /100 | #194 | Fair 64.6% |
| Immigrants | South Eastern Asia | 22.1 /100 | #195 | Fair 64.5% |
| Tongans | 21.2 /100 | #196 | Fair 64.5% |
| Costa Ricans | 19.6 /100 | #197 | Poor 64.4% |
| Tsimshian | 17.9 /100 | #198 | Poor 64.3% |
| Panamanians | 17.0 /100 | #199 | Poor 64.3% |
| Nigerians | 16.7 /100 | #200 | Poor 64.3% |
| French Canadians | 16.3 /100 | #201 | Poor 64.2% |
| South Americans | 16.2 /100 | #202 | Poor 64.2% |
| Uruguayans | 15.6 /100 | #203 | Poor 64.2% |
| Immigrants | Zaire | 14.6 /100 | #204 | Poor 64.1% |
| Peruvians | 13.7 /100 | #205 | Poor 64.1% |
| Whites/Caucasians | 12.8 /100 | #206 | Poor 64.0% |