Immigrants from Grenada vs Mexican College, Under 1 year
COMPARE
Immigrants from Grenada
Mexican
College, Under 1 year
College, Under 1 year Comparison
Immigrants from Grenada
Mexicans
59.1%
COLLEGE, UNDER 1 YEAR
0.0/ 100
METRIC RATING
295th/ 347
METRIC RANK
55.6%
COLLEGE, UNDER 1 YEAR
0.0/ 100
METRIC RATING
330th/ 347
METRIC RANK
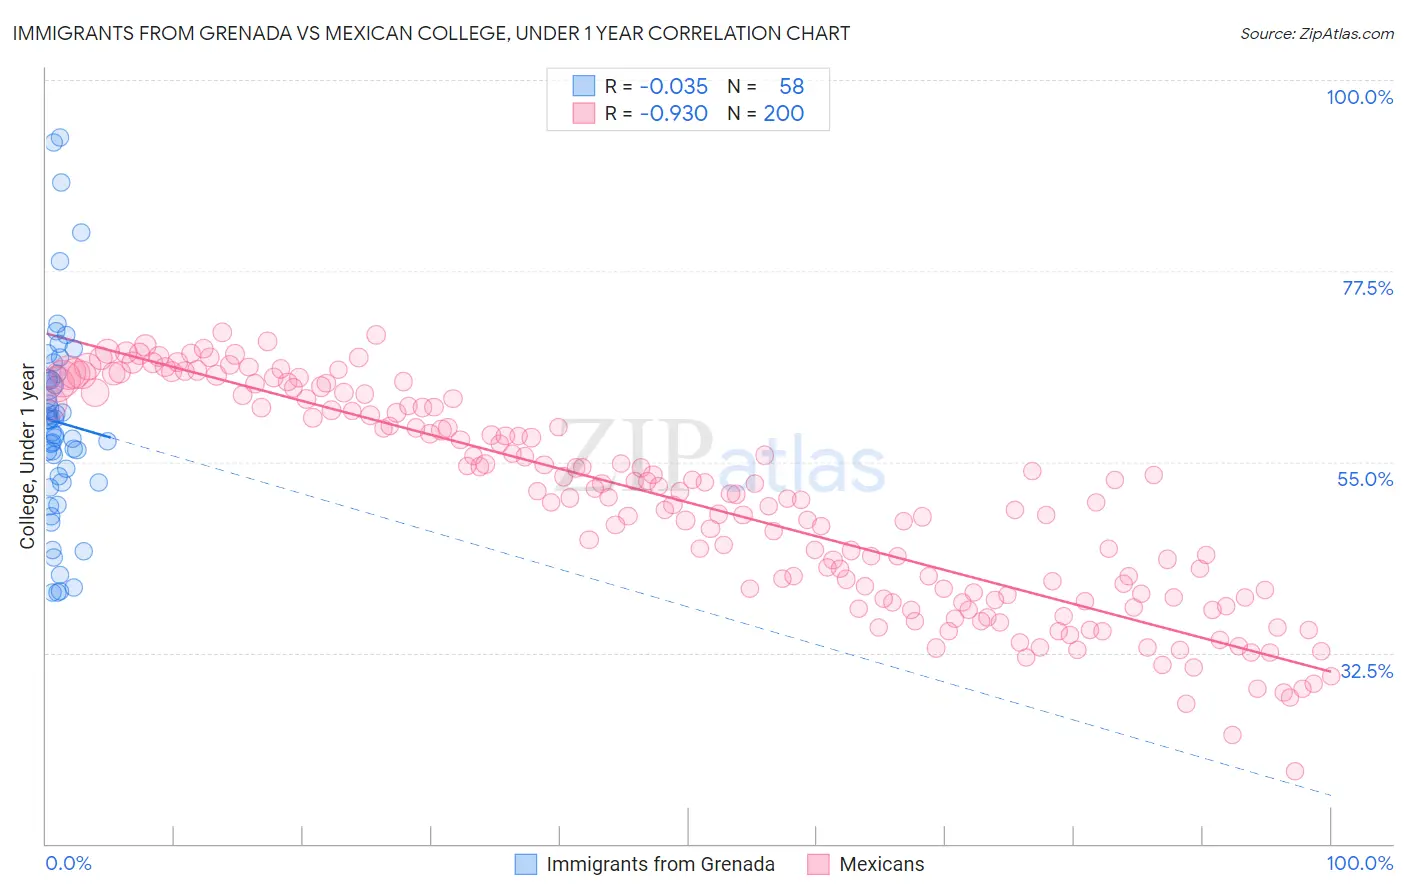
Immigrants from Grenada vs Mexican College, Under 1 year Correlation Chart
The statistical analysis conducted on geographies consisting of 67,201,096 people shows no correlation between the proportion of Immigrants from Grenada and percentage of population with at least college, under 1 year education in the United States with a correlation coefficient (R) of -0.035 and weighted average of 59.1%. Similarly, the statistical analysis conducted on geographies consisting of 565,321,978 people shows a near-perfect negative correlation between the proportion of Mexicans and percentage of population with at least college, under 1 year education in the United States with a correlation coefficient (R) of -0.930 and weighted average of 55.6%, a difference of 6.2%.
College, Under 1 year Correlation Summary
| Measurement | Immigrants from Grenada | Mexican |
| Minimum | 39.6% | 18.5% |
| Maximum | 93.2% | 70.3% |
| Range | 53.6% | 51.8% |
| Mean | 59.7% | 50.2% |
| Median | 59.3% | 51.0% |
| Interquartile 25% (IQ1) | 52.6% | 39.2% |
| Interquartile 75% (IQ3) | 64.8% | 61.5% |
| Interquartile Range (IQR) | 12.2% | 22.3% |
| Standard Deviation (Sample) | 11.9% | 12.4% |
| Standard Deviation (Population) | 11.8% | 12.4% |
Similar Demographics by College, Under 1 year
Demographics Similar to Immigrants from Grenada by College, Under 1 year
In terms of college, under 1 year, the demographic groups most similar to Immigrants from Grenada are Central American Indian (59.0%, a difference of 0.040%), Guyanese (59.0%, a difference of 0.080%), Immigrants from Belize (59.1%, a difference of 0.10%), Seminole (59.1%, a difference of 0.12%), and Nicaraguan (59.2%, a difference of 0.31%).
| Demographics | Rating | Rank | College, Under 1 year |
| Blacks/African Americans | 0.0 /100 | #288 | Tragic 59.4% |
| Choctaw | 0.0 /100 | #289 | Tragic 59.3% |
| Ecuadorians | 0.0 /100 | #290 | Tragic 59.3% |
| Creek | 0.0 /100 | #291 | Tragic 59.3% |
| Nicaraguans | 0.0 /100 | #292 | Tragic 59.2% |
| Seminole | 0.0 /100 | #293 | Tragic 59.1% |
| Immigrants | Belize | 0.0 /100 | #294 | Tragic 59.1% |
| Immigrants | Grenada | 0.0 /100 | #295 | Tragic 59.1% |
| Central American Indians | 0.0 /100 | #296 | Tragic 59.0% |
| Guyanese | 0.0 /100 | #297 | Tragic 59.0% |
| Immigrants | Ecuador | 0.0 /100 | #298 | Tragic 58.7% |
| Cubans | 0.0 /100 | #299 | Tragic 58.6% |
| Immigrants | Guyana | 0.0 /100 | #300 | Tragic 58.5% |
| Mexican American Indians | 0.0 /100 | #301 | Tragic 58.1% |
| Apache | 0.0 /100 | #302 | Tragic 58.0% |
Demographics Similar to Mexicans by College, Under 1 year
In terms of college, under 1 year, the demographic groups most similar to Mexicans are Immigrants from Cuba (55.7%, a difference of 0.13%), Dominican (55.5%, a difference of 0.26%), Immigrants from Yemen (55.3%, a difference of 0.67%), Cape Verdean (56.0%, a difference of 0.75%), and Yuman (55.1%, a difference of 0.99%).
| Demographics | Rating | Rank | College, Under 1 year |
| Immigrants | Honduras | 0.0 /100 | #323 | Tragic 56.5% |
| Immigrants | El Salvador | 0.0 /100 | #324 | Tragic 56.4% |
| Immigrants | Latin America | 0.0 /100 | #325 | Tragic 56.3% |
| Navajo | 0.0 /100 | #326 | Tragic 56.3% |
| Immigrants | Guatemala | 0.0 /100 | #327 | Tragic 56.2% |
| Cape Verdeans | 0.0 /100 | #328 | Tragic 56.0% |
| Immigrants | Cuba | 0.0 /100 | #329 | Tragic 55.7% |
| Mexicans | 0.0 /100 | #330 | Tragic 55.6% |
| Dominicans | 0.0 /100 | #331 | Tragic 55.5% |
| Immigrants | Yemen | 0.0 /100 | #332 | Tragic 55.3% |
| Yuman | 0.0 /100 | #333 | Tragic 55.1% |
| Immigrants | Azores | 0.0 /100 | #334 | Tragic 54.7% |
| Inupiat | 0.0 /100 | #335 | Tragic 54.6% |
| Pennsylvania Germans | 0.0 /100 | #336 | Tragic 54.5% |
| Immigrants | Central America | 0.0 /100 | #337 | Tragic 54.4% |