Immigrants from Grenada vs Yup'ik College, Under 1 year
COMPARE
Immigrants from Grenada
Yup'ik
College, Under 1 year
College, Under 1 year Comparison
Immigrants from Grenada
Yup'ik
59.1%
COLLEGE, UNDER 1 YEAR
0.0/ 100
METRIC RATING
295th/ 347
METRIC RANK
45.8%
COLLEGE, UNDER 1 YEAR
0.0/ 100
METRIC RATING
347th/ 347
METRIC RANK
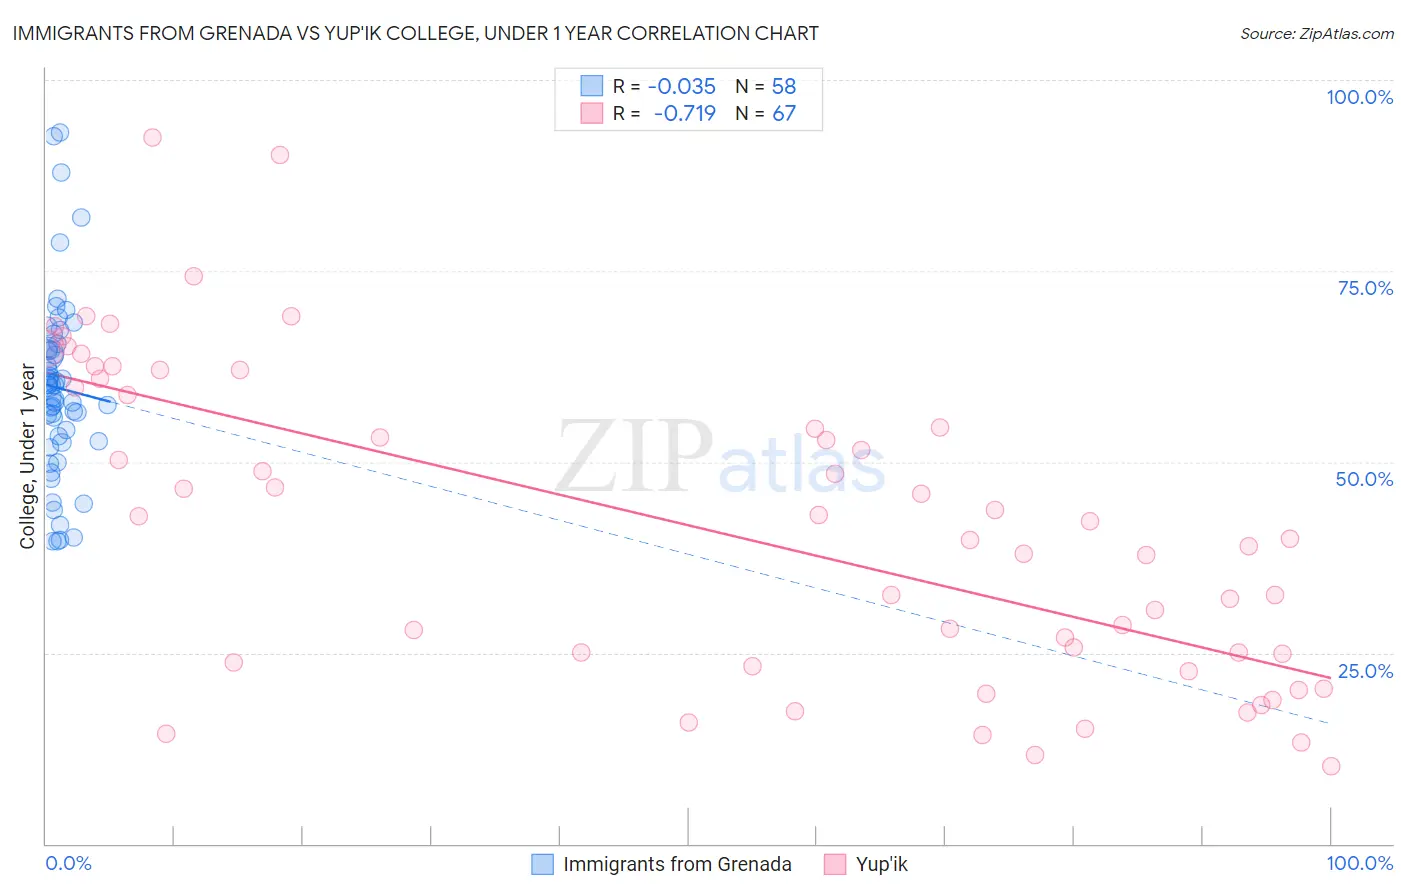
Immigrants from Grenada vs Yup'ik College, Under 1 year Correlation Chart
The statistical analysis conducted on geographies consisting of 67,201,096 people shows no correlation between the proportion of Immigrants from Grenada and percentage of population with at least college, under 1 year education in the United States with a correlation coefficient (R) of -0.035 and weighted average of 59.1%. Similarly, the statistical analysis conducted on geographies consisting of 39,964,395 people shows a strong negative correlation between the proportion of Yup'ik and percentage of population with at least college, under 1 year education in the United States with a correlation coefficient (R) of -0.719 and weighted average of 45.8%, a difference of 29.1%.
College, Under 1 year Correlation Summary
| Measurement | Immigrants from Grenada | Yup'ik |
| Minimum | 39.6% | 10.2% |
| Maximum | 93.2% | 92.4% |
| Range | 53.6% | 82.2% |
| Mean | 59.7% | 41.4% |
| Median | 59.3% | 40.0% |
| Interquartile 25% (IQ1) | 52.6% | 23.8% |
| Interquartile 75% (IQ3) | 64.8% | 59.8% |
| Interquartile Range (IQR) | 12.2% | 36.0% |
| Standard Deviation (Sample) | 11.9% | 20.3% |
| Standard Deviation (Population) | 11.8% | 20.2% |
Similar Demographics by College, Under 1 year
Demographics Similar to Immigrants from Grenada by College, Under 1 year
In terms of college, under 1 year, the demographic groups most similar to Immigrants from Grenada are Central American Indian (59.0%, a difference of 0.040%), Guyanese (59.0%, a difference of 0.080%), Immigrants from Belize (59.1%, a difference of 0.10%), Seminole (59.1%, a difference of 0.12%), and Nicaraguan (59.2%, a difference of 0.31%).
| Demographics | Rating | Rank | College, Under 1 year |
| Blacks/African Americans | 0.0 /100 | #288 | Tragic 59.4% |
| Choctaw | 0.0 /100 | #289 | Tragic 59.3% |
| Ecuadorians | 0.0 /100 | #290 | Tragic 59.3% |
| Creek | 0.0 /100 | #291 | Tragic 59.3% |
| Nicaraguans | 0.0 /100 | #292 | Tragic 59.2% |
| Seminole | 0.0 /100 | #293 | Tragic 59.1% |
| Immigrants | Belize | 0.0 /100 | #294 | Tragic 59.1% |
| Immigrants | Grenada | 0.0 /100 | #295 | Tragic 59.1% |
| Central American Indians | 0.0 /100 | #296 | Tragic 59.0% |
| Guyanese | 0.0 /100 | #297 | Tragic 59.0% |
| Immigrants | Ecuador | 0.0 /100 | #298 | Tragic 58.7% |
| Cubans | 0.0 /100 | #299 | Tragic 58.6% |
| Immigrants | Guyana | 0.0 /100 | #300 | Tragic 58.5% |
| Mexican American Indians | 0.0 /100 | #301 | Tragic 58.1% |
| Apache | 0.0 /100 | #302 | Tragic 58.0% |
Demographics Similar to Yup'ik by College, Under 1 year
In terms of college, under 1 year, the demographic groups most similar to Yup'ik are Houma (47.6%, a difference of 4.1%), Pima (51.4%, a difference of 12.4%), Yakama (52.6%, a difference of 15.0%), Tohono O'odham (52.8%, a difference of 15.3%), and Immigrants from Mexico (53.7%, a difference of 17.2%).
| Demographics | Rating | Rank | College, Under 1 year |
| Yuman | 0.0 /100 | #333 | Tragic 55.1% |
| Immigrants | Azores | 0.0 /100 | #334 | Tragic 54.7% |
| Inupiat | 0.0 /100 | #335 | Tragic 54.6% |
| Pennsylvania Germans | 0.0 /100 | #336 | Tragic 54.5% |
| Immigrants | Central America | 0.0 /100 | #337 | Tragic 54.4% |
| Lumbee | 0.0 /100 | #338 | Tragic 54.2% |
| Immigrants | Dominican Republic | 0.0 /100 | #339 | Tragic 54.0% |
| Spanish American Indians | 0.0 /100 | #340 | Tragic 54.0% |
| Immigrants | Cabo Verde | 0.0 /100 | #341 | Tragic 53.7% |
| Immigrants | Mexico | 0.0 /100 | #342 | Tragic 53.7% |
| Tohono O'odham | 0.0 /100 | #343 | Tragic 52.8% |
| Yakama | 0.0 /100 | #344 | Tragic 52.6% |
| Pima | 0.0 /100 | #345 | Tragic 51.4% |
| Houma | 0.0 /100 | #346 | Tragic 47.6% |
| Yup'ik | 0.0 /100 | #347 | Tragic 45.8% |