Ethiopian vs Lithuanian College, 1 year or more
COMPARE
Ethiopian
Lithuanian
College, 1 year or more
College, 1 year or more Comparison
Ethiopians
Lithuanians
62.9%
COLLEGE, 1 YEAR OR MORE
98.8/ 100
METRIC RATING
77th/ 347
METRIC RANK
62.9%
COLLEGE, 1 YEAR OR MORE
98.8/ 100
METRIC RATING
80th/ 347
METRIC RANK
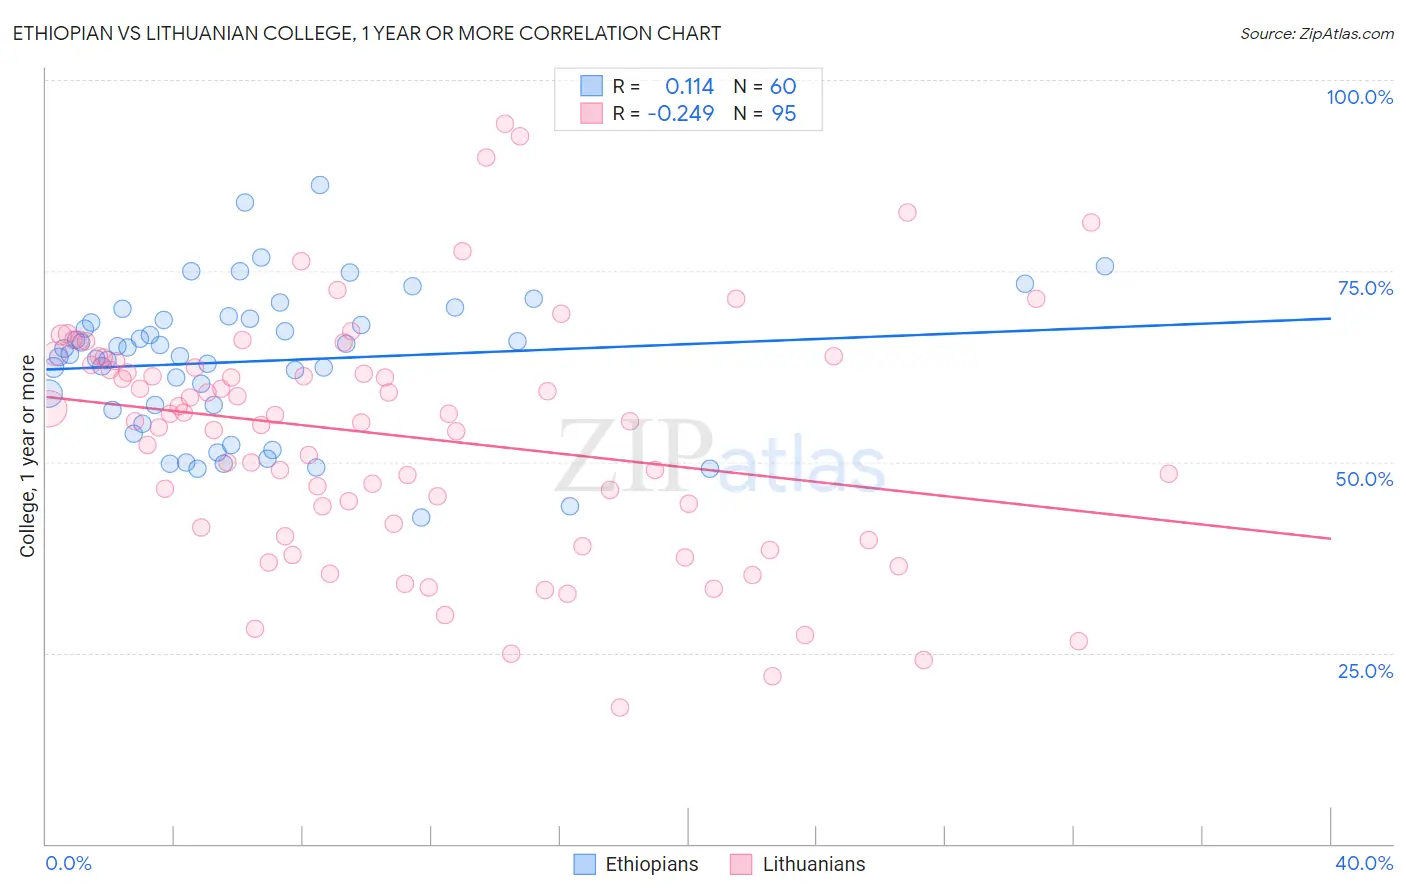
Ethiopian vs Lithuanian College, 1 year or more Correlation Chart
The statistical analysis conducted on geographies consisting of 223,259,495 people shows a poor positive correlation between the proportion of Ethiopians and percentage of population with at least college, 1 year or more education in the United States with a correlation coefficient (R) of 0.114 and weighted average of 62.9%. Similarly, the statistical analysis conducted on geographies consisting of 421,945,677 people shows a weak negative correlation between the proportion of Lithuanians and percentage of population with at least college, 1 year or more education in the United States with a correlation coefficient (R) of -0.249 and weighted average of 62.9%, a difference of 0.070%.
College, 1 year or more Correlation Summary
| Measurement | Ethiopian | Lithuanian |
| Minimum | 42.8% | 17.9% |
| Maximum | 86.2% | 94.2% |
| Range | 43.5% | 76.4% |
| Mean | 63.2% | 53.4% |
| Median | 64.5% | 55.4% |
| Interquartile 25% (IQ1) | 57.1% | 41.5% |
| Interquartile 75% (IQ3) | 68.7% | 63.2% |
| Interquartile Range (IQR) | 11.6% | 21.7% |
| Standard Deviation (Sample) | 9.3% | 15.7% |
| Standard Deviation (Population) | 9.2% | 15.7% |
Demographics Similar to Ethiopians and Lithuanians by College, 1 year or more
In terms of college, 1 year or more, the demographic groups most similar to Ethiopians are Paraguayan (62.9%, a difference of 0.0%), Immigrants from Lebanon (62.9%, a difference of 0.020%), Northern European (62.9%, a difference of 0.030%), Armenian (63.0%, a difference of 0.10%), and Laotian (62.8%, a difference of 0.12%). Similarly, the demographic groups most similar to Lithuanians are Northern European (62.9%, a difference of 0.040%), Immigrants from Lebanon (62.9%, a difference of 0.050%), Laotian (62.8%, a difference of 0.060%), Paraguayan (62.9%, a difference of 0.070%), and Immigrants from Bolivia (62.8%, a difference of 0.10%).
| Demographics | Rating | Rank | College, 1 year or more |
| Immigrants | Greece | 99.3 /100 | #68 | Exceptional 63.3% |
| Immigrants | Zimbabwe | 99.3 /100 | #69 | Exceptional 63.3% |
| Argentineans | 99.2 /100 | #70 | Exceptional 63.2% |
| Immigrants | Canada | 99.1 /100 | #71 | Exceptional 63.1% |
| Egyptians | 99.0 /100 | #72 | Exceptional 63.1% |
| Immigrants | Moldova | 99.0 /100 | #73 | Exceptional 63.0% |
| Immigrants | North America | 99.0 /100 | #74 | Exceptional 63.0% |
| Armenians | 98.9 /100 | #75 | Exceptional 63.0% |
| Paraguayans | 98.8 /100 | #76 | Exceptional 62.9% |
| Ethiopians | 98.8 /100 | #77 | Exceptional 62.9% |
| Immigrants | Lebanon | 98.8 /100 | #78 | Exceptional 62.9% |
| Northern Europeans | 98.8 /100 | #79 | Exceptional 62.9% |
| Lithuanians | 98.8 /100 | #80 | Exceptional 62.9% |
| Laotians | 98.7 /100 | #81 | Exceptional 62.8% |
| Immigrants | Bolivia | 98.7 /100 | #82 | Exceptional 62.8% |
| Immigrants | Argentina | 98.6 /100 | #83 | Exceptional 62.8% |
| Immigrants | England | 98.6 /100 | #84 | Exceptional 62.8% |
| Immigrants | Pakistan | 98.6 /100 | #85 | Exceptional 62.8% |
| Immigrants | Western Europe | 98.6 /100 | #86 | Exceptional 62.7% |
| Immigrants | Hungary | 98.6 /100 | #87 | Exceptional 62.7% |
| Greeks | 98.3 /100 | #88 | Exceptional 62.6% |