Immigrants from Egypt vs Lithuanian Median Earnings
COMPARE
Immigrants from Egypt
Lithuanian
Median Earnings
Median Earnings Comparison
Immigrants from Egypt
Lithuanians
$50,901
MEDIAN EARNINGS
99.8/ 100
METRIC RATING
72nd/ 347
METRIC RANK
$50,991
MEDIAN EARNINGS
99.8/ 100
METRIC RATING
70th/ 347
METRIC RANK
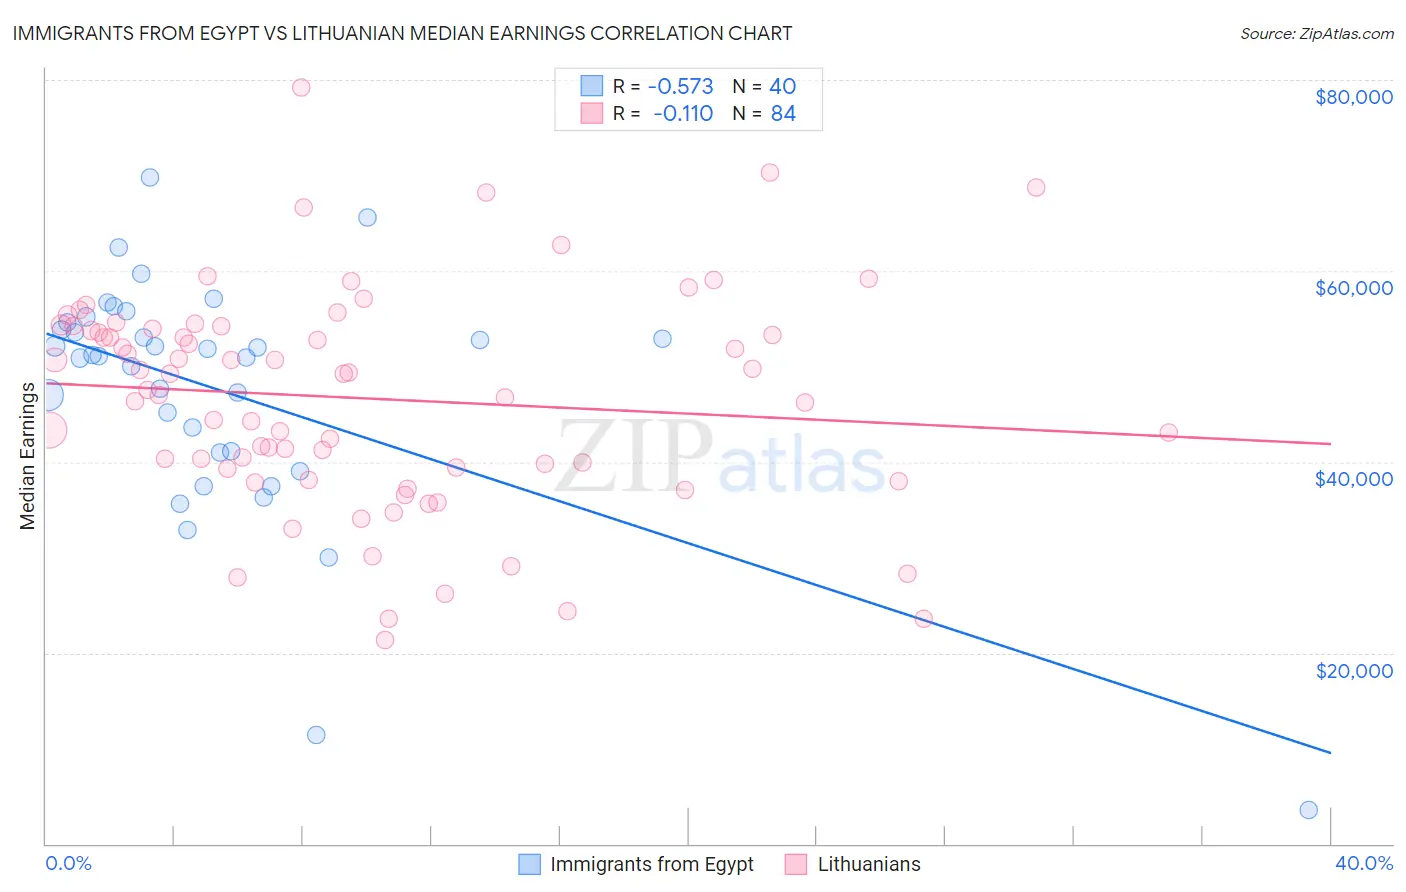
Immigrants from Egypt vs Lithuanian Median Earnings Correlation Chart
The statistical analysis conducted on geographies consisting of 245,492,399 people shows a substantial negative correlation between the proportion of Immigrants from Egypt and median earnings in the United States with a correlation coefficient (R) of -0.573 and weighted average of $50,901. Similarly, the statistical analysis conducted on geographies consisting of 421,906,288 people shows a poor negative correlation between the proportion of Lithuanians and median earnings in the United States with a correlation coefficient (R) of -0.110 and weighted average of $50,991, a difference of 0.18%.
Median Earnings Correlation Summary
| Measurement | Immigrants from Egypt | Lithuanian |
| Minimum | $3,500 | $21,331 |
| Maximum | $69,809 | $79,217 |
| Range | $66,309 | $57,886 |
| Mean | $47,452 | $46,654 |
| Median | $51,173 | $48,402 |
| Interquartile 25% (IQ1) | $41,070 | $39,359 |
| Interquartile 75% (IQ3) | $54,227 | $54,080 |
| Interquartile Range (IQR) | $13,157 | $14,721 |
| Standard Deviation (Sample) | $12,746 | $11,467 |
| Standard Deviation (Population) | $12,585 | $11,398 |
Demographics Similar to Immigrants from Egypt and Lithuanians by Median Earnings
In terms of median earnings, the demographic groups most similar to Immigrants from Egypt are Immigrants from Ukraine ($50,984, a difference of 0.16%), Immigrants from Netherlands ($50,818, a difference of 0.16%), Mongolian ($51,038, a difference of 0.27%), South African ($50,752, a difference of 0.29%), and Immigrants from Scotland ($50,741, a difference of 0.32%). Similarly, the demographic groups most similar to Lithuanians are Immigrants from Ukraine ($50,984, a difference of 0.010%), Mongolian ($51,038, a difference of 0.090%), Paraguayan ($51,068, a difference of 0.15%), Immigrants from Spain ($51,092, a difference of 0.20%), and Afghan ($51,112, a difference of 0.24%).
| Demographics | Rating | Rank | Median Earnings |
| Immigrants | Latvia | 99.9 /100 | #61 | Exceptional $51,555 |
| Immigrants | Romania | 99.9 /100 | #62 | Exceptional $51,337 |
| Immigrants | Bulgaria | 99.9 /100 | #63 | Exceptional $51,318 |
| New Zealanders | 99.9 /100 | #64 | Exceptional $51,246 |
| Greeks | 99.9 /100 | #65 | Exceptional $51,164 |
| Afghans | 99.9 /100 | #66 | Exceptional $51,112 |
| Immigrants | Spain | 99.9 /100 | #67 | Exceptional $51,092 |
| Paraguayans | 99.9 /100 | #68 | Exceptional $51,068 |
| Mongolians | 99.8 /100 | #69 | Exceptional $51,038 |
| Lithuanians | 99.8 /100 | #70 | Exceptional $50,991 |
| Immigrants | Ukraine | 99.8 /100 | #71 | Exceptional $50,984 |
| Immigrants | Egypt | 99.8 /100 | #72 | Exceptional $50,901 |
| Immigrants | Netherlands | 99.8 /100 | #73 | Exceptional $50,818 |
| South Africans | 99.8 /100 | #74 | Exceptional $50,752 |
| Immigrants | Scotland | 99.8 /100 | #75 | Exceptional $50,741 |
| Immigrants | Italy | 99.7 /100 | #76 | Exceptional $50,581 |
| Immigrants | Western Europe | 99.7 /100 | #77 | Exceptional $50,549 |
| Argentineans | 99.6 /100 | #78 | Exceptional $50,399 |
| Laotians | 99.6 /100 | #79 | Exceptional $50,343 |
| Ukrainians | 99.6 /100 | #80 | Exceptional $50,320 |
| Immigrants | Southern Europe | 99.6 /100 | #81 | Exceptional $50,280 |