Norwegian vs Lithuanian College, 1 year or more
COMPARE
Norwegian
Lithuanian
College, 1 year or more
College, 1 year or more Comparison
Norwegians
Lithuanians
61.7%
COLLEGE, 1 YEAR OR MORE
94.5/ 100
METRIC RATING
115th/ 347
METRIC RANK
62.9%
COLLEGE, 1 YEAR OR MORE
98.8/ 100
METRIC RATING
80th/ 347
METRIC RANK
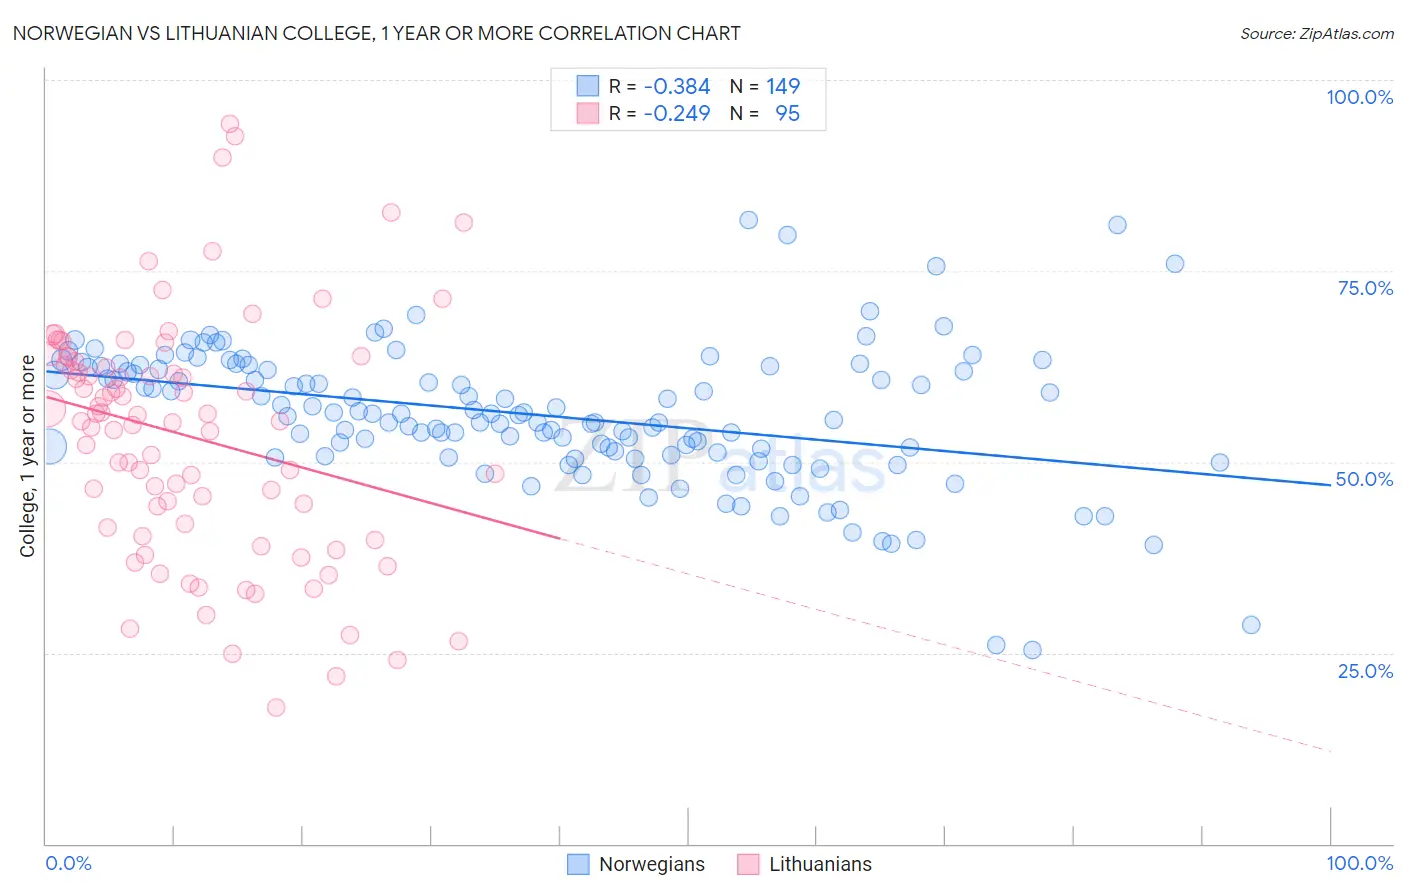
Norwegian vs Lithuanian College, 1 year or more Correlation Chart
The statistical analysis conducted on geographies consisting of 533,389,627 people shows a mild negative correlation between the proportion of Norwegians and percentage of population with at least college, 1 year or more education in the United States with a correlation coefficient (R) of -0.384 and weighted average of 61.7%. Similarly, the statistical analysis conducted on geographies consisting of 421,945,677 people shows a weak negative correlation between the proportion of Lithuanians and percentage of population with at least college, 1 year or more education in the United States with a correlation coefficient (R) of -0.249 and weighted average of 62.9%, a difference of 2.0%.
College, 1 year or more Correlation Summary
| Measurement | Norwegian | Lithuanian |
| Minimum | 25.4% | 17.9% |
| Maximum | 81.7% | 94.2% |
| Range | 56.3% | 76.4% |
| Mean | 56.1% | 53.4% |
| Median | 56.3% | 55.4% |
| Interquartile 25% (IQ1) | 51.0% | 41.5% |
| Interquartile 75% (IQ3) | 62.5% | 63.2% |
| Interquartile Range (IQR) | 11.4% | 21.7% |
| Standard Deviation (Sample) | 9.1% | 15.7% |
| Standard Deviation (Population) | 9.1% | 15.7% |
Similar Demographics by College, 1 year or more
Demographics Similar to Norwegians by College, 1 year or more
In terms of college, 1 year or more, the demographic groups most similar to Norwegians are Danish (61.7%, a difference of 0.070%), Lebanese (61.6%, a difference of 0.10%), Arab (61.6%, a difference of 0.14%), Immigrants from Brazil (61.6%, a difference of 0.15%), and Ukrainian (61.8%, a difference of 0.18%).
| Demographics | Rating | Rank | College, 1 year or more |
| Syrians | 95.7 /100 | #108 | Exceptional 61.9% |
| Immigrants | Northern Africa | 95.7 /100 | #109 | Exceptional 61.9% |
| Europeans | 95.6 /100 | #110 | Exceptional 61.8% |
| Macedonians | 95.6 /100 | #111 | Exceptional 61.8% |
| Austrians | 95.4 /100 | #112 | Exceptional 61.8% |
| Ukrainians | 95.2 /100 | #113 | Exceptional 61.8% |
| Danes | 94.8 /100 | #114 | Exceptional 61.7% |
| Norwegians | 94.5 /100 | #115 | Exceptional 61.7% |
| Lebanese | 94.1 /100 | #116 | Exceptional 61.6% |
| Arabs | 93.9 /100 | #117 | Exceptional 61.6% |
| Immigrants | Brazil | 93.9 /100 | #118 | Exceptional 61.6% |
| Assyrians/Chaldeans/Syriacs | 93.3 /100 | #119 | Exceptional 61.5% |
| Pakistanis | 93.2 /100 | #120 | Exceptional 61.5% |
| Immigrants | Jordan | 92.7 /100 | #121 | Exceptional 61.4% |
| Immigrants | Chile | 92.3 /100 | #122 | Exceptional 61.4% |
Demographics Similar to Lithuanians by College, 1 year or more
In terms of college, 1 year or more, the demographic groups most similar to Lithuanians are Northern European (62.9%, a difference of 0.040%), Immigrants from Lebanon (62.9%, a difference of 0.050%), Laotian (62.8%, a difference of 0.060%), Paraguayan (62.9%, a difference of 0.070%), and Ethiopian (62.9%, a difference of 0.070%).
| Demographics | Rating | Rank | College, 1 year or more |
| Immigrants | Moldova | 99.0 /100 | #73 | Exceptional 63.0% |
| Immigrants | North America | 99.0 /100 | #74 | Exceptional 63.0% |
| Armenians | 98.9 /100 | #75 | Exceptional 63.0% |
| Paraguayans | 98.8 /100 | #76 | Exceptional 62.9% |
| Ethiopians | 98.8 /100 | #77 | Exceptional 62.9% |
| Immigrants | Lebanon | 98.8 /100 | #78 | Exceptional 62.9% |
| Northern Europeans | 98.8 /100 | #79 | Exceptional 62.9% |
| Lithuanians | 98.8 /100 | #80 | Exceptional 62.9% |
| Laotians | 98.7 /100 | #81 | Exceptional 62.8% |
| Immigrants | Bolivia | 98.7 /100 | #82 | Exceptional 62.8% |
| Immigrants | Argentina | 98.6 /100 | #83 | Exceptional 62.8% |
| Immigrants | England | 98.6 /100 | #84 | Exceptional 62.8% |
| Immigrants | Pakistan | 98.6 /100 | #85 | Exceptional 62.8% |
| Immigrants | Western Europe | 98.6 /100 | #86 | Exceptional 62.7% |
| Immigrants | Hungary | 98.6 /100 | #87 | Exceptional 62.7% |