Immigrants from Japan vs Lithuanian College, 1 year or more
COMPARE
Immigrants from Japan
Lithuanian
College, 1 year or more
College, 1 year or more Comparison
Immigrants from Japan
Lithuanians
66.7%
COLLEGE, 1 YEAR OR MORE
100.0/ 100
METRIC RATING
16th/ 347
METRIC RANK
62.9%
COLLEGE, 1 YEAR OR MORE
98.8/ 100
METRIC RATING
80th/ 347
METRIC RANK
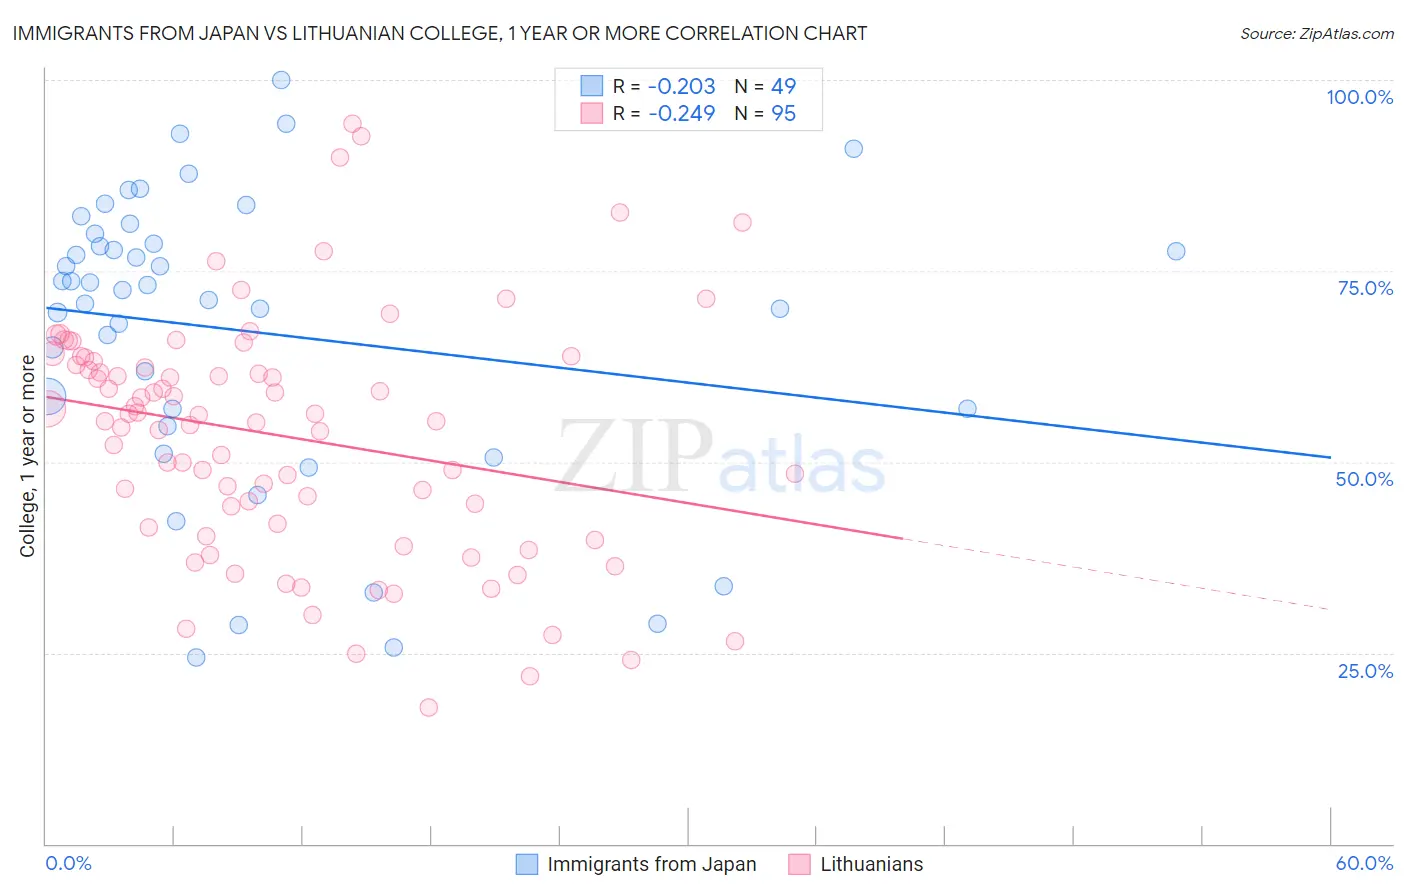
Immigrants from Japan vs Lithuanian College, 1 year or more Correlation Chart
The statistical analysis conducted on geographies consisting of 340,147,719 people shows a weak negative correlation between the proportion of Immigrants from Japan and percentage of population with at least college, 1 year or more education in the United States with a correlation coefficient (R) of -0.203 and weighted average of 66.7%. Similarly, the statistical analysis conducted on geographies consisting of 421,945,677 people shows a weak negative correlation between the proportion of Lithuanians and percentage of population with at least college, 1 year or more education in the United States with a correlation coefficient (R) of -0.249 and weighted average of 62.9%, a difference of 6.0%.
College, 1 year or more Correlation Summary
| Measurement | Immigrants from Japan | Lithuanian |
| Minimum | 24.4% | 17.9% |
| Maximum | 100.0% | 94.2% |
| Range | 75.6% | 76.4% |
| Mean | 67.0% | 53.4% |
| Median | 72.5% | 55.4% |
| Interquartile 25% (IQ1) | 55.8% | 41.5% |
| Interquartile 75% (IQ3) | 79.2% | 63.2% |
| Interquartile Range (IQR) | 23.4% | 21.7% |
| Standard Deviation (Sample) | 19.1% | 15.7% |
| Standard Deviation (Population) | 18.9% | 15.7% |
Similar Demographics by College, 1 year or more
Demographics Similar to Immigrants from Japan by College, 1 year or more
In terms of college, 1 year or more, the demographic groups most similar to Immigrants from Japan are Cambodian (66.7%, a difference of 0.030%), Burmese (66.7%, a difference of 0.040%), Immigrants from Eastern Asia (66.6%, a difference of 0.11%), Eastern European (66.6%, a difference of 0.19%), and Immigrants from Sweden (66.8%, a difference of 0.23%).
| Demographics | Rating | Rank | College, 1 year or more |
| Immigrants | Israel | 100.0 /100 | #9 | Exceptional 67.8% |
| Immigrants | Australia | 100.0 /100 | #10 | Exceptional 67.7% |
| Immigrants | South Central Asia | 100.0 /100 | #11 | Exceptional 67.1% |
| Cypriots | 100.0 /100 | #12 | Exceptional 67.0% |
| Immigrants | Sweden | 100.0 /100 | #13 | Exceptional 66.8% |
| Burmese | 100.0 /100 | #14 | Exceptional 66.7% |
| Cambodians | 100.0 /100 | #15 | Exceptional 66.7% |
| Immigrants | Japan | 100.0 /100 | #16 | Exceptional 66.7% |
| Immigrants | Eastern Asia | 100.0 /100 | #17 | Exceptional 66.6% |
| Eastern Europeans | 100.0 /100 | #18 | Exceptional 66.6% |
| Immigrants | Switzerland | 100.0 /100 | #19 | Exceptional 66.5% |
| Immigrants | Korea | 100.0 /100 | #20 | Exceptional 66.5% |
| Immigrants | Hong Kong | 100.0 /100 | #21 | Exceptional 66.4% |
| Soviet Union | 100.0 /100 | #22 | Exceptional 66.4% |
| Immigrants | China | 100.0 /100 | #23 | Exceptional 66.4% |
Demographics Similar to Lithuanians by College, 1 year or more
In terms of college, 1 year or more, the demographic groups most similar to Lithuanians are Northern European (62.9%, a difference of 0.040%), Immigrants from Lebanon (62.9%, a difference of 0.050%), Laotian (62.8%, a difference of 0.060%), Paraguayan (62.9%, a difference of 0.070%), and Ethiopian (62.9%, a difference of 0.070%).
| Demographics | Rating | Rank | College, 1 year or more |
| Immigrants | Moldova | 99.0 /100 | #73 | Exceptional 63.0% |
| Immigrants | North America | 99.0 /100 | #74 | Exceptional 63.0% |
| Armenians | 98.9 /100 | #75 | Exceptional 63.0% |
| Paraguayans | 98.8 /100 | #76 | Exceptional 62.9% |
| Ethiopians | 98.8 /100 | #77 | Exceptional 62.9% |
| Immigrants | Lebanon | 98.8 /100 | #78 | Exceptional 62.9% |
| Northern Europeans | 98.8 /100 | #79 | Exceptional 62.9% |
| Lithuanians | 98.8 /100 | #80 | Exceptional 62.9% |
| Laotians | 98.7 /100 | #81 | Exceptional 62.8% |
| Immigrants | Bolivia | 98.7 /100 | #82 | Exceptional 62.8% |
| Immigrants | Argentina | 98.6 /100 | #83 | Exceptional 62.8% |
| Immigrants | England | 98.6 /100 | #84 | Exceptional 62.8% |
| Immigrants | Pakistan | 98.6 /100 | #85 | Exceptional 62.8% |
| Immigrants | Western Europe | 98.6 /100 | #86 | Exceptional 62.7% |
| Immigrants | Hungary | 98.6 /100 | #87 | Exceptional 62.7% |