Immigrants from Egypt vs Lithuanian Associate's Degree
COMPARE
Immigrants from Egypt
Lithuanian
Associate's Degree
Associate's Degree Comparison
Immigrants from Egypt
Lithuanians
50.2%
ASSOCIATE'S DEGREE
98.9/ 100
METRIC RATING
85th/ 347
METRIC RANK
50.6%
ASSOCIATE'S DEGREE
99.3/ 100
METRIC RATING
74th/ 347
METRIC RANK
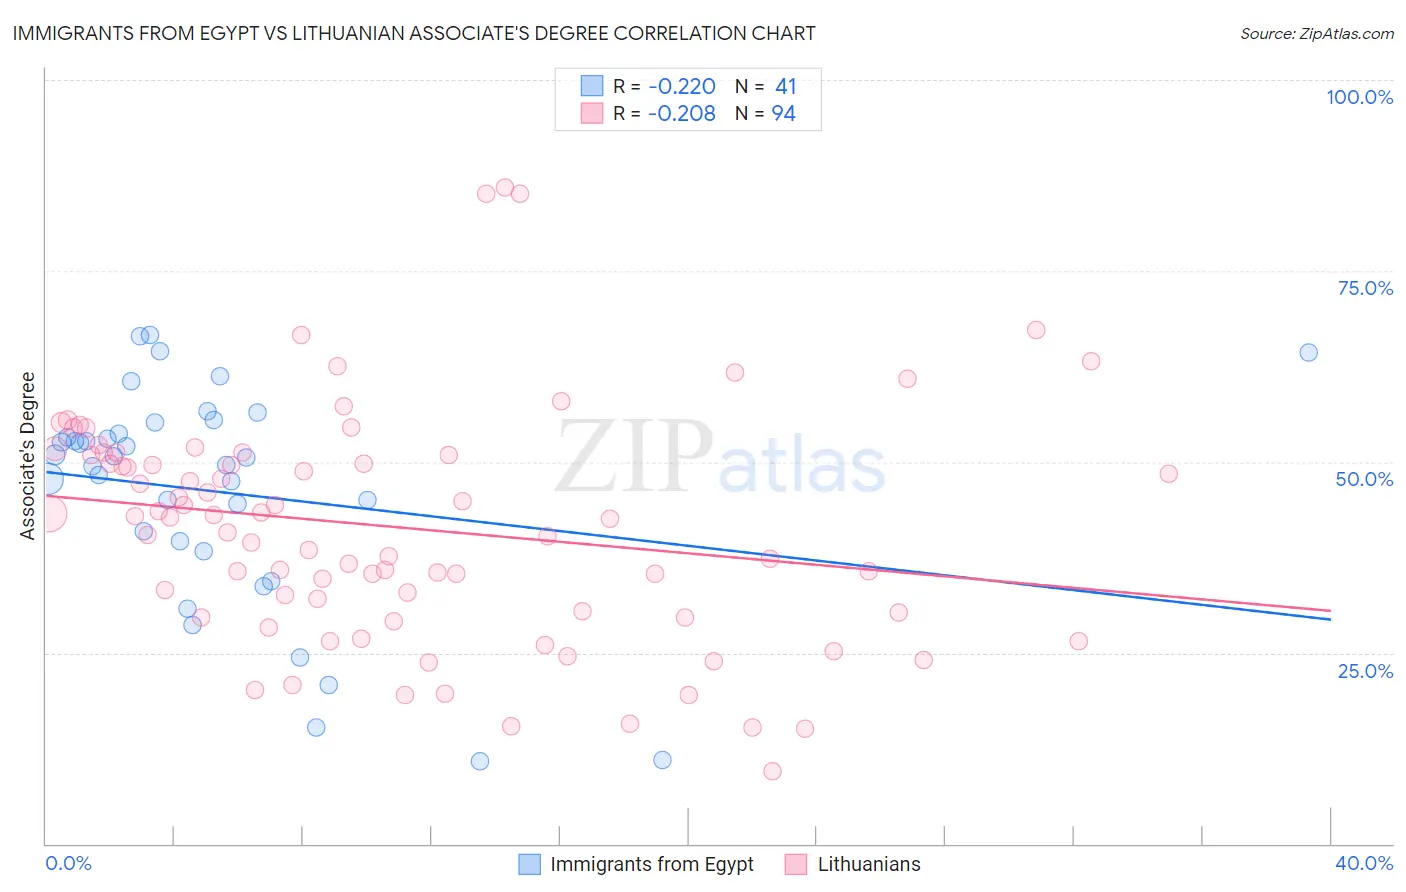
Immigrants from Egypt vs Lithuanian Associate's Degree Correlation Chart
The statistical analysis conducted on geographies consisting of 245,484,715 people shows a weak negative correlation between the proportion of Immigrants from Egypt and percentage of population with at least associate's degree education in the United States with a correlation coefficient (R) of -0.220 and weighted average of 50.2%. Similarly, the statistical analysis conducted on geographies consisting of 421,924,512 people shows a weak negative correlation between the proportion of Lithuanians and percentage of population with at least associate's degree education in the United States with a correlation coefficient (R) of -0.208 and weighted average of 50.6%, a difference of 0.78%.
Associate's Degree Correlation Summary
| Measurement | Immigrants from Egypt | Lithuanian |
| Minimum | 10.8% | 9.5% |
| Maximum | 66.7% | 85.9% |
| Range | 55.9% | 76.4% |
| Mean | 46.0% | 41.4% |
| Median | 50.5% | 42.6% |
| Interquartile 25% (IQ1) | 38.9% | 30.2% |
| Interquartile 75% (IQ3) | 54.4% | 50.9% |
| Interquartile Range (IQR) | 15.5% | 20.7% |
| Standard Deviation (Sample) | 14.4% | 15.3% |
| Standard Deviation (Population) | 14.2% | 15.3% |
Demographics Similar to Immigrants from Egypt and Lithuanians by Associate's Degree
In terms of associate's degree, the demographic groups most similar to Immigrants from Egypt are Immigrants from Croatia (50.2%, a difference of 0.010%), Immigrants from Hungary (50.2%, a difference of 0.050%), Immigrants from Uzbekistan (50.3%, a difference of 0.070%), Greek (50.3%, a difference of 0.11%), and Immigrants from Moldova (50.2%, a difference of 0.13%). Similarly, the demographic groups most similar to Lithuanians are Immigrants from Scotland (50.6%, a difference of 0.040%), Carpatho Rusyn (50.6%, a difference of 0.060%), Immigrants from Zimbabwe (50.5%, a difference of 0.25%), Immigrants from Lebanon (50.5%, a difference of 0.28%), and Immigrants from Eastern Europe (50.5%, a difference of 0.33%).
| Demographics | Rating | Rank | Associate's Degree |
| Egyptians | 99.5 /100 | #69 | Exceptional 50.9% |
| Immigrants | Argentina | 99.5 /100 | #70 | Exceptional 50.9% |
| Immigrants | Romania | 99.5 /100 | #71 | Exceptional 50.9% |
| Immigrants | Pakistan | 99.5 /100 | #72 | Exceptional 50.9% |
| Carpatho Rusyns | 99.3 /100 | #73 | Exceptional 50.6% |
| Lithuanians | 99.3 /100 | #74 | Exceptional 50.6% |
| Immigrants | Scotland | 99.3 /100 | #75 | Exceptional 50.6% |
| Immigrants | Zimbabwe | 99.2 /100 | #76 | Exceptional 50.5% |
| Immigrants | Lebanon | 99.1 /100 | #77 | Exceptional 50.5% |
| Immigrants | Eastern Europe | 99.1 /100 | #78 | Exceptional 50.5% |
| Ethiopians | 99.1 /100 | #79 | Exceptional 50.4% |
| Armenians | 99.1 /100 | #80 | Exceptional 50.4% |
| Maltese | 99.1 /100 | #81 | Exceptional 50.4% |
| Greeks | 98.9 /100 | #82 | Exceptional 50.3% |
| Immigrants | Uzbekistan | 98.9 /100 | #83 | Exceptional 50.3% |
| Immigrants | Hungary | 98.9 /100 | #84 | Exceptional 50.2% |
| Immigrants | Egypt | 98.9 /100 | #85 | Exceptional 50.2% |
| Immigrants | Croatia | 98.9 /100 | #86 | Exceptional 50.2% |
| Immigrants | Moldova | 98.8 /100 | #87 | Exceptional 50.2% |
| Immigrants | Canada | 98.7 /100 | #88 | Exceptional 50.1% |
| Immigrants | Western Europe | 98.7 /100 | #89 | Exceptional 50.1% |