Immigrants from Ecuador vs Menominee College, Under 1 year
COMPARE
Immigrants from Ecuador
Menominee
College, Under 1 year
College, Under 1 year Comparison
Immigrants from Ecuador
Menominee
58.7%
COLLEGE, UNDER 1 YEAR
0.0/ 100
METRIC RATING
298th/ 347
METRIC RANK
57.0%
COLLEGE, UNDER 1 YEAR
0.0/ 100
METRIC RATING
316th/ 347
METRIC RANK
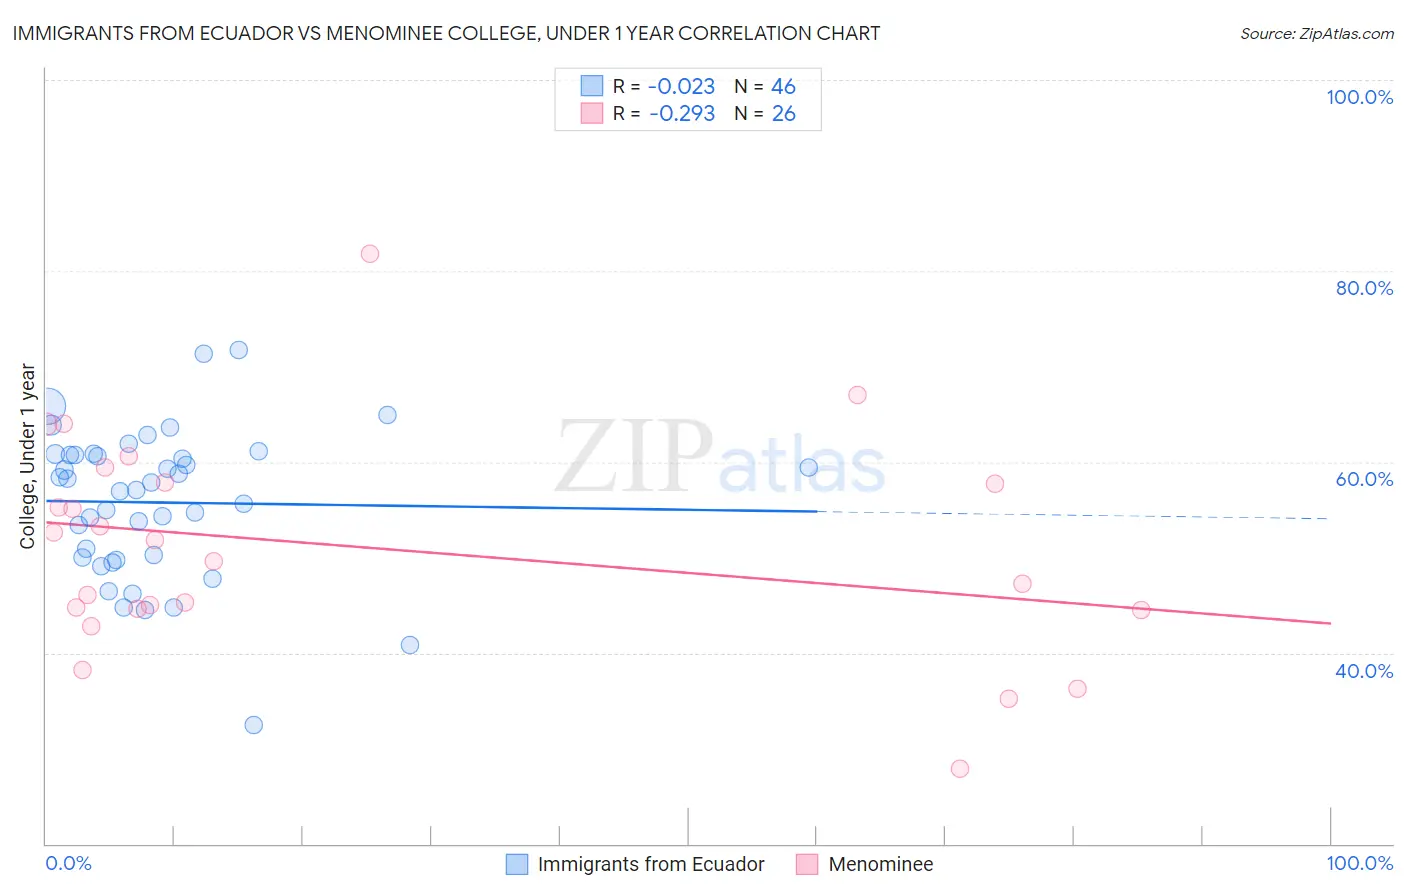
Immigrants from Ecuador vs Menominee College, Under 1 year Correlation Chart
The statistical analysis conducted on geographies consisting of 270,962,752 people shows no correlation between the proportion of Immigrants from Ecuador and percentage of population with at least college, under 1 year education in the United States with a correlation coefficient (R) of -0.023 and weighted average of 58.7%. Similarly, the statistical analysis conducted on geographies consisting of 45,778,979 people shows a weak negative correlation between the proportion of Menominee and percentage of population with at least college, under 1 year education in the United States with a correlation coefficient (R) of -0.293 and weighted average of 57.0%, a difference of 2.9%.
College, Under 1 year Correlation Summary
| Measurement | Immigrants from Ecuador | Menominee |
| Minimum | 32.4% | 27.9% |
| Maximum | 71.7% | 81.8% |
| Range | 39.3% | 53.9% |
| Mean | 55.7% | 51.1% |
| Median | 57.5% | 50.7% |
| Interquartile 25% (IQ1) | 49.9% | 44.6% |
| Interquartile 75% (IQ3) | 60.7% | 57.9% |
| Interquartile Range (IQR) | 10.8% | 13.3% |
| Standard Deviation (Sample) | 7.8% | 11.5% |
| Standard Deviation (Population) | 7.7% | 11.3% |
Demographics Similar to Immigrants from Ecuador and Menominee by College, Under 1 year
In terms of college, under 1 year, the demographic groups most similar to Immigrants from Ecuador are Cuban (58.6%, a difference of 0.13%), Immigrants from Guyana (58.5%, a difference of 0.39%), Guyanese (59.0%, a difference of 0.50%), Mexican American Indian (58.1%, a difference of 1.0%), and Apache (58.0%, a difference of 1.2%). Similarly, the demographic groups most similar to Menominee are Hispanic or Latino (57.0%, a difference of 0.040%), Honduran (57.1%, a difference of 0.050%), Hopi (57.1%, a difference of 0.10%), Dutch West Indian (57.2%, a difference of 0.22%), and Salvadoran (57.3%, a difference of 0.46%).
| Demographics | Rating | Rank | College, Under 1 year |
| Guyanese | 0.0 /100 | #297 | Tragic 59.0% |
| Immigrants | Ecuador | 0.0 /100 | #298 | Tragic 58.7% |
| Cubans | 0.0 /100 | #299 | Tragic 58.6% |
| Immigrants | Guyana | 0.0 /100 | #300 | Tragic 58.5% |
| Mexican American Indians | 0.0 /100 | #301 | Tragic 58.1% |
| Apache | 0.0 /100 | #302 | Tragic 58.0% |
| Immigrants | Dominica | 0.0 /100 | #303 | Tragic 57.9% |
| Kiowa | 0.0 /100 | #304 | Tragic 57.8% |
| Haitians | 0.0 /100 | #305 | Tragic 57.8% |
| Immigrants | Portugal | 0.0 /100 | #306 | Tragic 57.7% |
| Fijians | 0.0 /100 | #307 | Tragic 57.7% |
| Central Americans | 0.0 /100 | #308 | Tragic 57.7% |
| Immigrants | Nicaragua | 0.0 /100 | #309 | Tragic 57.6% |
| Pueblo | 0.0 /100 | #310 | Tragic 57.4% |
| Cajuns | 0.0 /100 | #311 | Tragic 57.3% |
| Salvadorans | 0.0 /100 | #312 | Tragic 57.3% |
| Dutch West Indians | 0.0 /100 | #313 | Tragic 57.2% |
| Hopi | 0.0 /100 | #314 | Tragic 57.1% |
| Hondurans | 0.0 /100 | #315 | Tragic 57.1% |
| Menominee | 0.0 /100 | #316 | Tragic 57.0% |
| Hispanics or Latinos | 0.0 /100 | #317 | Tragic 57.0% |