Immigrants from Ecuador vs Immigrants from Albania College, Under 1 year
COMPARE
Immigrants from Ecuador
Immigrants from Albania
College, Under 1 year
College, Under 1 year Comparison
Immigrants from Ecuador
Immigrants from Albania
58.7%
COLLEGE, UNDER 1 YEAR
0.0/ 100
METRIC RATING
298th/ 347
METRIC RANK
64.9%
COLLEGE, UNDER 1 YEAR
32.0/ 100
METRIC RATING
188th/ 347
METRIC RANK
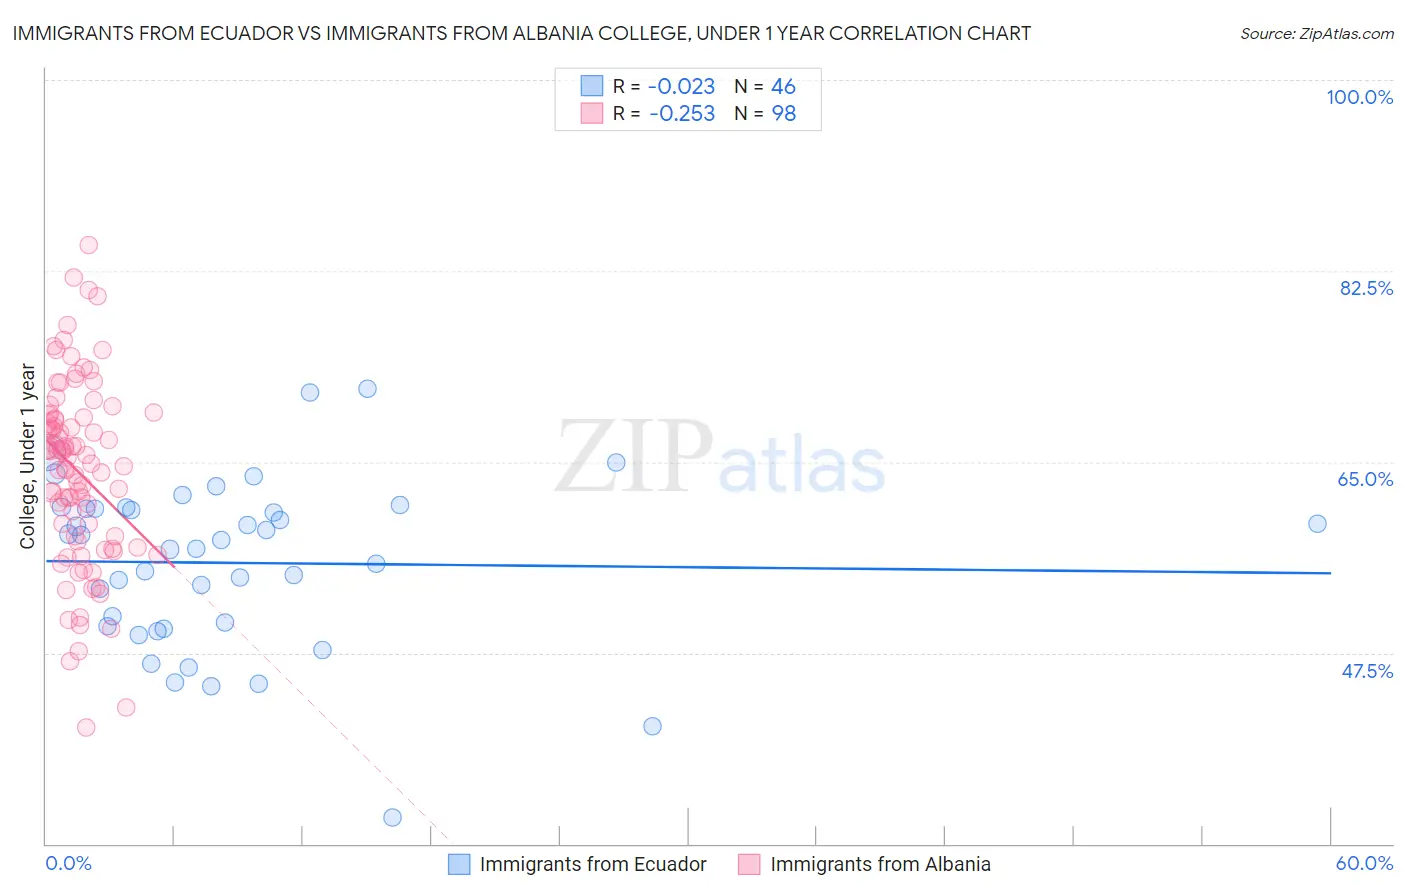
Immigrants from Ecuador vs Immigrants from Albania College, Under 1 year Correlation Chart
The statistical analysis conducted on geographies consisting of 270,962,752 people shows no correlation between the proportion of Immigrants from Ecuador and percentage of population with at least college, under 1 year education in the United States with a correlation coefficient (R) of -0.023 and weighted average of 58.7%. Similarly, the statistical analysis conducted on geographies consisting of 119,397,636 people shows a weak negative correlation between the proportion of Immigrants from Albania and percentage of population with at least college, under 1 year education in the United States with a correlation coefficient (R) of -0.253 and weighted average of 64.9%, a difference of 10.5%.
College, Under 1 year Correlation Summary
| Measurement | Immigrants from Ecuador | Immigrants from Albania |
| Minimum | 32.4% | 40.7% |
| Maximum | 71.7% | 84.9% |
| Range | 39.3% | 44.2% |
| Mean | 55.7% | 64.1% |
| Median | 57.5% | 65.5% |
| Interquartile 25% (IQ1) | 49.9% | 58.2% |
| Interquartile 75% (IQ3) | 60.7% | 69.1% |
| Interquartile Range (IQR) | 10.8% | 10.9% |
| Standard Deviation (Sample) | 7.8% | 8.4% |
| Standard Deviation (Population) | 7.7% | 8.4% |
Similar Demographics by College, Under 1 year
Demographics Similar to Immigrants from Ecuador by College, Under 1 year
In terms of college, under 1 year, the demographic groups most similar to Immigrants from Ecuador are Cuban (58.6%, a difference of 0.13%), Immigrants from Guyana (58.5%, a difference of 0.39%), Guyanese (59.0%, a difference of 0.50%), Central American Indian (59.0%, a difference of 0.55%), and Immigrants from Grenada (59.1%, a difference of 0.59%).
| Demographics | Rating | Rank | College, Under 1 year |
| Creek | 0.0 /100 | #291 | Tragic 59.3% |
| Nicaraguans | 0.0 /100 | #292 | Tragic 59.2% |
| Seminole | 0.0 /100 | #293 | Tragic 59.1% |
| Immigrants | Belize | 0.0 /100 | #294 | Tragic 59.1% |
| Immigrants | Grenada | 0.0 /100 | #295 | Tragic 59.1% |
| Central American Indians | 0.0 /100 | #296 | Tragic 59.0% |
| Guyanese | 0.0 /100 | #297 | Tragic 59.0% |
| Immigrants | Ecuador | 0.0 /100 | #298 | Tragic 58.7% |
| Cubans | 0.0 /100 | #299 | Tragic 58.6% |
| Immigrants | Guyana | 0.0 /100 | #300 | Tragic 58.5% |
| Mexican American Indians | 0.0 /100 | #301 | Tragic 58.1% |
| Apache | 0.0 /100 | #302 | Tragic 58.0% |
| Immigrants | Dominica | 0.0 /100 | #303 | Tragic 57.9% |
| Kiowa | 0.0 /100 | #304 | Tragic 57.8% |
| Haitians | 0.0 /100 | #305 | Tragic 57.8% |
Demographics Similar to Immigrants from Albania by College, Under 1 year
In terms of college, under 1 year, the demographic groups most similar to Immigrants from Albania are Spanish (64.9%, a difference of 0.020%), Immigrants from Philippines (64.8%, a difference of 0.10%), Immigrants from Southern Europe (64.9%, a difference of 0.11%), Immigrants from Armenia (64.7%, a difference of 0.21%), and Immigrants from Thailand (64.7%, a difference of 0.27%).
| Demographics | Rating | Rank | College, Under 1 year |
| Spaniards | 45.5 /100 | #181 | Average 65.3% |
| Immigrants | Africa | 44.7 /100 | #182 | Average 65.3% |
| Immigrants | Poland | 42.6 /100 | #183 | Average 65.2% |
| Bermudans | 42.0 /100 | #184 | Average 65.2% |
| Sri Lankans | 41.7 /100 | #185 | Average 65.2% |
| Immigrants | Sierra Leone | 39.7 /100 | #186 | Fair 65.1% |
| Immigrants | Southern Europe | 34.3 /100 | #187 | Fair 64.9% |
| Immigrants | Albania | 32.0 /100 | #188 | Fair 64.9% |
| Spanish | 31.6 /100 | #189 | Fair 64.9% |
| Immigrants | Philippines | 30.1 /100 | #190 | Fair 64.8% |
| Immigrants | Armenia | 28.1 /100 | #191 | Fair 64.7% |
| Immigrants | Thailand | 27.0 /100 | #192 | Fair 64.7% |
| Slovaks | 26.7 /100 | #193 | Fair 64.7% |
| Immigrants | Cameroon | 24.6 /100 | #194 | Fair 64.6% |
| Immigrants | South Eastern Asia | 22.1 /100 | #195 | Fair 64.5% |