Immigrants from Ecuador vs Immigrants from Netherlands College, Under 1 year
COMPARE
Immigrants from Ecuador
Immigrants from Netherlands
College, Under 1 year
College, Under 1 year Comparison
Immigrants from Ecuador
Immigrants from Netherlands
58.7%
COLLEGE, UNDER 1 YEAR
0.0/ 100
METRIC RATING
298th/ 347
METRIC RANK
70.0%
COLLEGE, UNDER 1 YEAR
99.8/ 100
METRIC RATING
48th/ 347
METRIC RANK
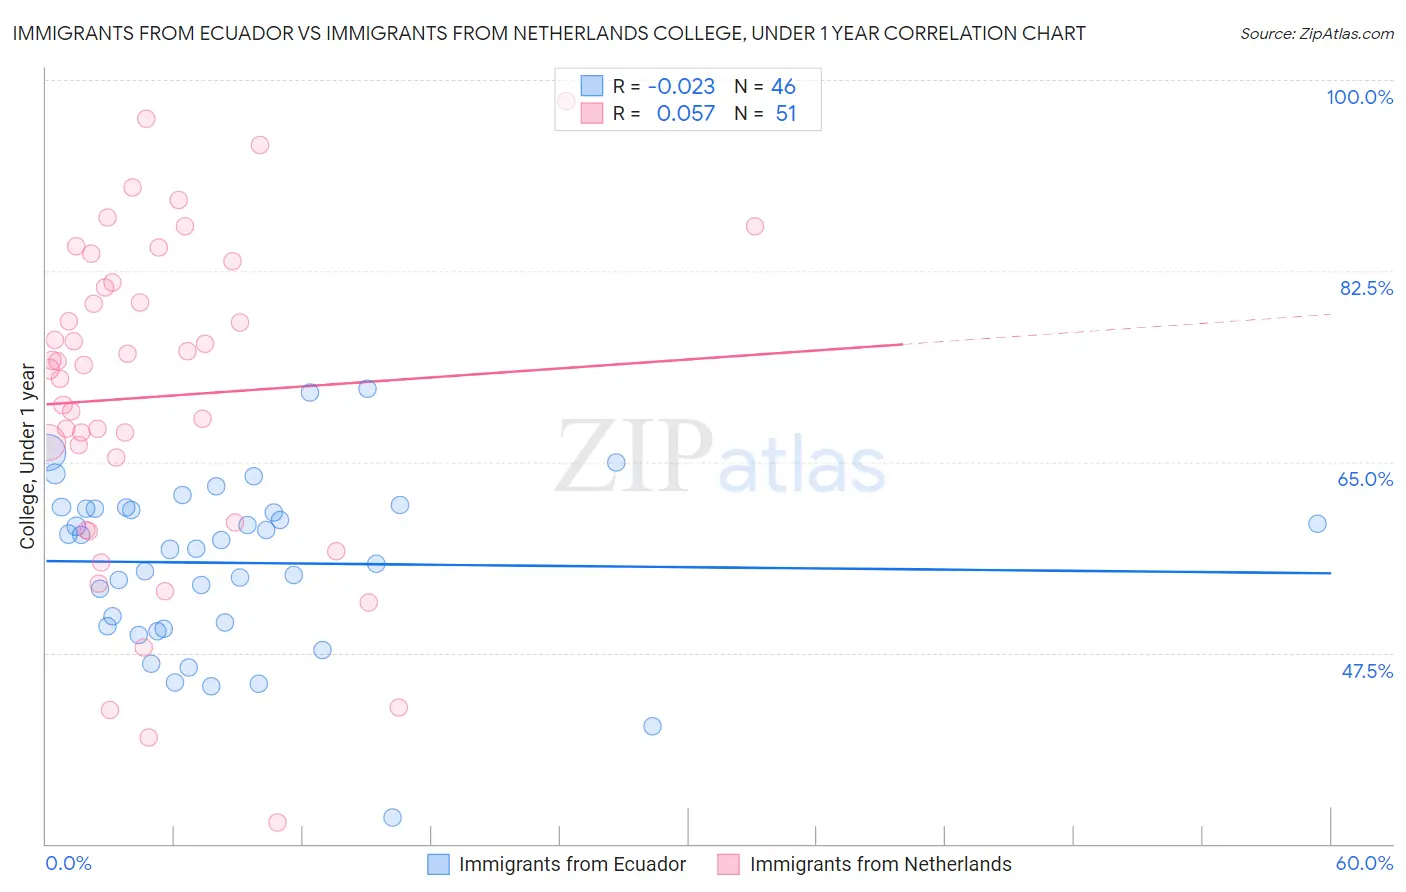
Immigrants from Ecuador vs Immigrants from Netherlands College, Under 1 year Correlation Chart
The statistical analysis conducted on geographies consisting of 270,962,752 people shows no correlation between the proportion of Immigrants from Ecuador and percentage of population with at least college, under 1 year education in the United States with a correlation coefficient (R) of -0.023 and weighted average of 58.7%. Similarly, the statistical analysis conducted on geographies consisting of 237,877,405 people shows a slight positive correlation between the proportion of Immigrants from Netherlands and percentage of population with at least college, under 1 year education in the United States with a correlation coefficient (R) of 0.057 and weighted average of 70.0%, a difference of 19.2%.
College, Under 1 year Correlation Summary
| Measurement | Immigrants from Ecuador | Immigrants from Netherlands |
| Minimum | 32.4% | 32.0% |
| Maximum | 71.7% | 98.1% |
| Range | 39.3% | 66.1% |
| Mean | 55.7% | 71.0% |
| Median | 57.5% | 73.9% |
| Interquartile 25% (IQ1) | 49.9% | 59.4% |
| Interquartile 75% (IQ3) | 60.7% | 81.4% |
| Interquartile Range (IQR) | 10.8% | 22.0% |
| Standard Deviation (Sample) | 7.8% | 15.0% |
| Standard Deviation (Population) | 7.7% | 14.9% |
Similar Demographics by College, Under 1 year
Demographics Similar to Immigrants from Ecuador by College, Under 1 year
In terms of college, under 1 year, the demographic groups most similar to Immigrants from Ecuador are Cuban (58.6%, a difference of 0.13%), Immigrants from Guyana (58.5%, a difference of 0.39%), Guyanese (59.0%, a difference of 0.50%), Central American Indian (59.0%, a difference of 0.55%), and Immigrants from Grenada (59.1%, a difference of 0.59%).
| Demographics | Rating | Rank | College, Under 1 year |
| Creek | 0.0 /100 | #291 | Tragic 59.3% |
| Nicaraguans | 0.0 /100 | #292 | Tragic 59.2% |
| Seminole | 0.0 /100 | #293 | Tragic 59.1% |
| Immigrants | Belize | 0.0 /100 | #294 | Tragic 59.1% |
| Immigrants | Grenada | 0.0 /100 | #295 | Tragic 59.1% |
| Central American Indians | 0.0 /100 | #296 | Tragic 59.0% |
| Guyanese | 0.0 /100 | #297 | Tragic 59.0% |
| Immigrants | Ecuador | 0.0 /100 | #298 | Tragic 58.7% |
| Cubans | 0.0 /100 | #299 | Tragic 58.6% |
| Immigrants | Guyana | 0.0 /100 | #300 | Tragic 58.5% |
| Mexican American Indians | 0.0 /100 | #301 | Tragic 58.1% |
| Apache | 0.0 /100 | #302 | Tragic 58.0% |
| Immigrants | Dominica | 0.0 /100 | #303 | Tragic 57.9% |
| Kiowa | 0.0 /100 | #304 | Tragic 57.8% |
| Haitians | 0.0 /100 | #305 | Tragic 57.8% |
Demographics Similar to Immigrants from Netherlands by College, Under 1 year
In terms of college, under 1 year, the demographic groups most similar to Immigrants from Netherlands are Immigrants from Austria (70.0%, a difference of 0.040%), Immigrants from Bulgaria (70.0%, a difference of 0.060%), Zimbabwean (69.9%, a difference of 0.16%), Immigrants from Latvia (70.1%, a difference of 0.17%), and Mongolian (69.9%, a difference of 0.20%).
| Demographics | Rating | Rank | College, Under 1 year |
| Immigrants | Kuwait | 99.9 /100 | #41 | Exceptional 70.3% |
| Immigrants | Lithuania | 99.9 /100 | #42 | Exceptional 70.3% |
| Israelis | 99.9 /100 | #43 | Exceptional 70.2% |
| New Zealanders | 99.9 /100 | #44 | Exceptional 70.2% |
| Immigrants | Norway | 99.9 /100 | #45 | Exceptional 70.2% |
| Immigrants | Latvia | 99.9 /100 | #46 | Exceptional 70.1% |
| Immigrants | Bulgaria | 99.8 /100 | #47 | Exceptional 70.0% |
| Immigrants | Netherlands | 99.8 /100 | #48 | Exceptional 70.0% |
| Immigrants | Austria | 99.8 /100 | #49 | Exceptional 70.0% |
| Zimbabweans | 99.8 /100 | #50 | Exceptional 69.9% |
| Mongolians | 99.8 /100 | #51 | Exceptional 69.9% |
| Immigrants | Russia | 99.8 /100 | #52 | Exceptional 69.9% |
| South Africans | 99.7 /100 | #53 | Exceptional 69.7% |
| Immigrants | Czechoslovakia | 99.7 /100 | #54 | Exceptional 69.6% |
| Maltese | 99.7 /100 | #55 | Exceptional 69.5% |