Immigrants from Ecuador vs Eastern European College, Under 1 year
COMPARE
Immigrants from Ecuador
Eastern European
College, Under 1 year
College, Under 1 year Comparison
Immigrants from Ecuador
Eastern Europeans
58.7%
COLLEGE, UNDER 1 YEAR
0.0/ 100
METRIC RATING
298th/ 347
METRIC RANK
71.8%
COLLEGE, UNDER 1 YEAR
100.0/ 100
METRIC RATING
17th/ 347
METRIC RANK
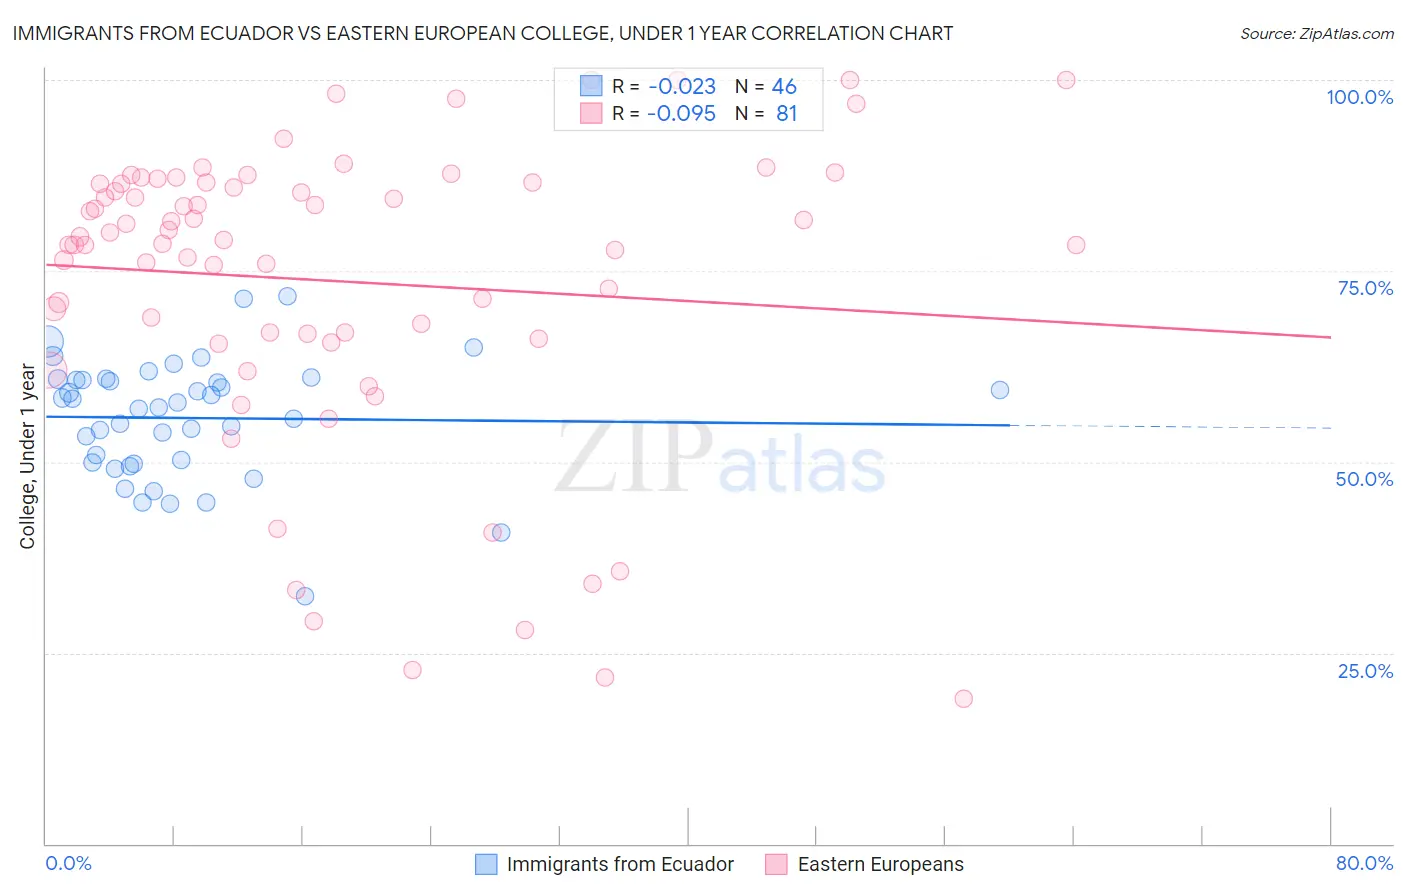
Immigrants from Ecuador vs Eastern European College, Under 1 year Correlation Chart
The statistical analysis conducted on geographies consisting of 270,962,752 people shows no correlation between the proportion of Immigrants from Ecuador and percentage of population with at least college, under 1 year education in the United States with a correlation coefficient (R) of -0.023 and weighted average of 58.7%. Similarly, the statistical analysis conducted on geographies consisting of 461,244,527 people shows a slight negative correlation between the proportion of Eastern Europeans and percentage of population with at least college, under 1 year education in the United States with a correlation coefficient (R) of -0.095 and weighted average of 71.8%, a difference of 22.2%.
College, Under 1 year Correlation Summary
| Measurement | Immigrants from Ecuador | Eastern European |
| Minimum | 32.4% | 19.0% |
| Maximum | 71.7% | 100.0% |
| Range | 39.3% | 81.0% |
| Mean | 55.7% | 73.7% |
| Median | 57.5% | 79.0% |
| Interquartile 25% (IQ1) | 49.9% | 66.5% |
| Interquartile 75% (IQ3) | 60.7% | 86.5% |
| Interquartile Range (IQR) | 10.8% | 20.0% |
| Standard Deviation (Sample) | 7.8% | 19.5% |
| Standard Deviation (Population) | 7.7% | 19.4% |
Similar Demographics by College, Under 1 year
Demographics Similar to Immigrants from Ecuador by College, Under 1 year
In terms of college, under 1 year, the demographic groups most similar to Immigrants from Ecuador are Cuban (58.6%, a difference of 0.13%), Immigrants from Guyana (58.5%, a difference of 0.39%), Guyanese (59.0%, a difference of 0.50%), Central American Indian (59.0%, a difference of 0.55%), and Immigrants from Grenada (59.1%, a difference of 0.59%).
| Demographics | Rating | Rank | College, Under 1 year |
| Creek | 0.0 /100 | #291 | Tragic 59.3% |
| Nicaraguans | 0.0 /100 | #292 | Tragic 59.2% |
| Seminole | 0.0 /100 | #293 | Tragic 59.1% |
| Immigrants | Belize | 0.0 /100 | #294 | Tragic 59.1% |
| Immigrants | Grenada | 0.0 /100 | #295 | Tragic 59.1% |
| Central American Indians | 0.0 /100 | #296 | Tragic 59.0% |
| Guyanese | 0.0 /100 | #297 | Tragic 59.0% |
| Immigrants | Ecuador | 0.0 /100 | #298 | Tragic 58.7% |
| Cubans | 0.0 /100 | #299 | Tragic 58.6% |
| Immigrants | Guyana | 0.0 /100 | #300 | Tragic 58.5% |
| Mexican American Indians | 0.0 /100 | #301 | Tragic 58.1% |
| Apache | 0.0 /100 | #302 | Tragic 58.0% |
| Immigrants | Dominica | 0.0 /100 | #303 | Tragic 57.9% |
| Kiowa | 0.0 /100 | #304 | Tragic 57.8% |
| Haitians | 0.0 /100 | #305 | Tragic 57.8% |
Demographics Similar to Eastern Europeans by College, Under 1 year
In terms of college, under 1 year, the demographic groups most similar to Eastern Europeans are Immigrants from Switzerland (71.7%, a difference of 0.13%), Immigrants from Japan (71.9%, a difference of 0.14%), Cambodian (71.9%, a difference of 0.16%), Burmese (71.9%, a difference of 0.16%), and Latvian (71.6%, a difference of 0.24%).
| Demographics | Rating | Rank | College, Under 1 year |
| Immigrants | Israel | 100.0 /100 | #10 | Exceptional 72.3% |
| Immigrants | South Central Asia | 100.0 /100 | #11 | Exceptional 72.1% |
| Immigrants | Sweden | 100.0 /100 | #12 | Exceptional 72.1% |
| Cypriots | 100.0 /100 | #13 | Exceptional 72.0% |
| Cambodians | 100.0 /100 | #14 | Exceptional 71.9% |
| Burmese | 100.0 /100 | #15 | Exceptional 71.9% |
| Immigrants | Japan | 100.0 /100 | #16 | Exceptional 71.9% |
| Eastern Europeans | 100.0 /100 | #17 | Exceptional 71.8% |
| Immigrants | Switzerland | 100.0 /100 | #18 | Exceptional 71.7% |
| Latvians | 100.0 /100 | #19 | Exceptional 71.6% |
| Immigrants | Korea | 100.0 /100 | #20 | Exceptional 71.6% |
| Immigrants | Belgium | 100.0 /100 | #21 | Exceptional 71.5% |
| Immigrants | Eastern Asia | 100.0 /100 | #22 | Exceptional 71.3% |
| Immigrants | Northern Europe | 100.0 /100 | #23 | Exceptional 71.1% |
| Soviet Union | 100.0 /100 | #24 | Exceptional 71.1% |