Immigrants from Eastern Asia vs Immigrants from Korea GED/Equivalency
COMPARE
Immigrants from Eastern Asia
Immigrants from Korea
GED/Equivalency
GED/Equivalency Comparison
Immigrants from Eastern Asia
Immigrants from Korea
87.4%
GED/EQUIVALENCY
97.9/ 100
METRIC RATING
91st/ 347
METRIC RANK
88.1%
GED/EQUIVALENCY
99.5/ 100
METRIC RATING
50th/ 347
METRIC RANK
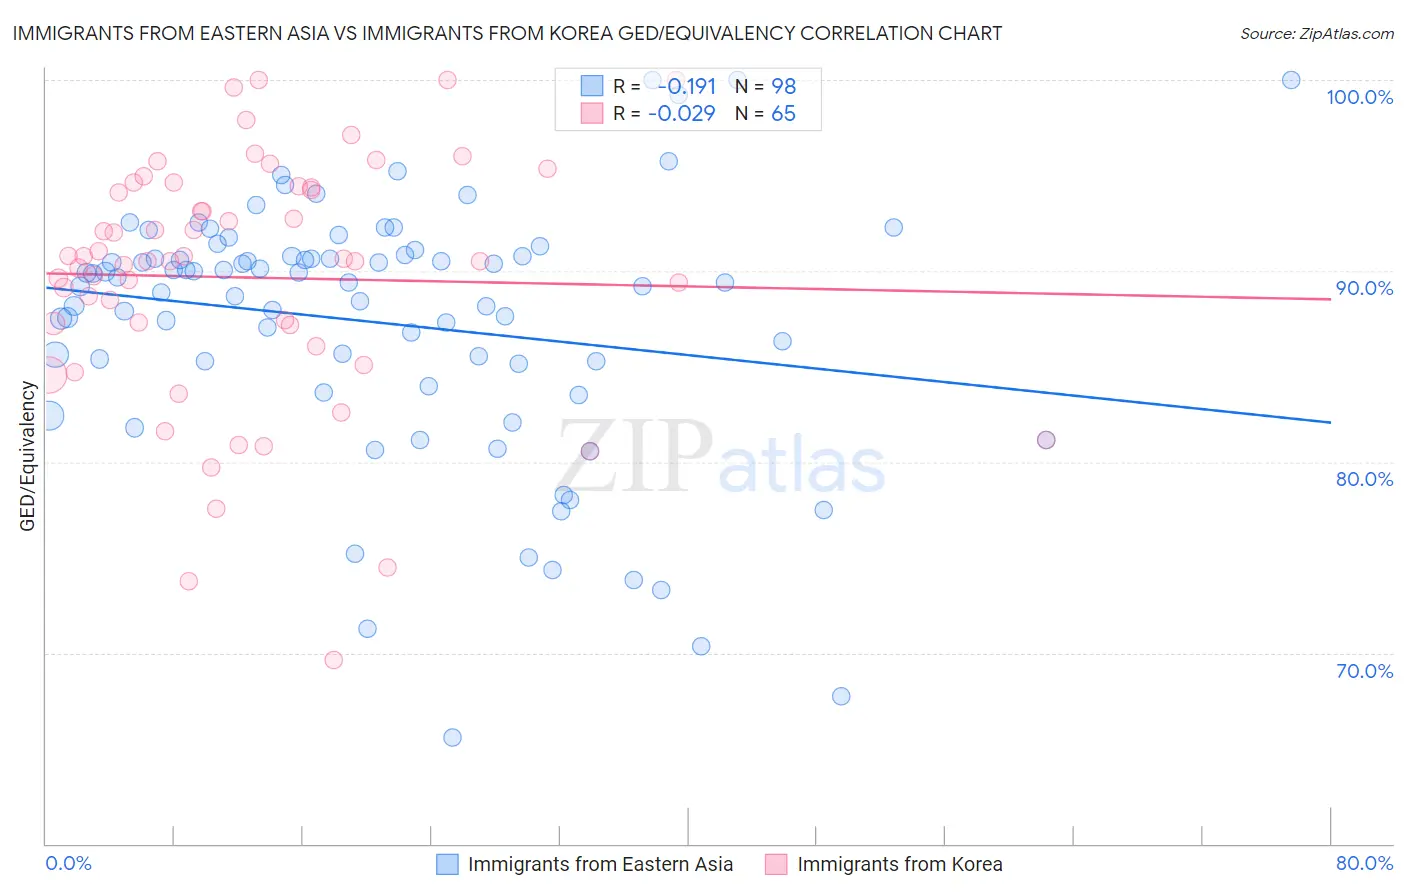
Immigrants from Eastern Asia vs Immigrants from Korea GED/Equivalency Correlation Chart
The statistical analysis conducted on geographies consisting of 499,846,164 people shows a poor negative correlation between the proportion of Immigrants from Eastern Asia and percentage of population with at least ged/equivalency education in the United States with a correlation coefficient (R) of -0.191 and weighted average of 87.4%. Similarly, the statistical analysis conducted on geographies consisting of 416,280,217 people shows no correlation between the proportion of Immigrants from Korea and percentage of population with at least ged/equivalency education in the United States with a correlation coefficient (R) of -0.029 and weighted average of 88.1%, a difference of 0.70%.
GED/Equivalency Correlation Summary
| Measurement | Immigrants from Eastern Asia | Immigrants from Korea |
| Minimum | 65.6% | 69.6% |
| Maximum | 100.0% | 100.0% |
| Range | 34.4% | 30.4% |
| Mean | 87.3% | 89.7% |
| Median | 89.4% | 90.5% |
| Interquartile 25% (IQ1) | 85.1% | 86.6% |
| Interquartile 75% (IQ3) | 90.8% | 94.4% |
| Interquartile Range (IQR) | 5.6% | 7.8% |
| Standard Deviation (Sample) | 6.8% | 6.5% |
| Standard Deviation (Population) | 6.8% | 6.5% |
Similar Demographics by GED/Equivalency
Demographics Similar to Immigrants from Eastern Asia by GED/Equivalency
In terms of ged/equivalency, the demographic groups most similar to Immigrants from Eastern Asia are Hungarian (87.4%, a difference of 0.010%), Welsh (87.4%, a difference of 0.010%), Israeli (87.4%, a difference of 0.010%), Immigrants from North Macedonia (87.4%, a difference of 0.020%), and Immigrants from Russia (87.4%, a difference of 0.020%).
| Demographics | Rating | Rank | GED/Equivalency |
| Immigrants | Romania | 98.1 /100 | #84 | Exceptional 87.5% |
| Dutch | 98.1 /100 | #85 | Exceptional 87.5% |
| Immigrants | Europe | 98.1 /100 | #86 | Exceptional 87.5% |
| Native Hawaiians | 98.1 /100 | #87 | Exceptional 87.5% |
| Immigrants | Norway | 98.1 /100 | #88 | Exceptional 87.5% |
| Hungarians | 97.9 /100 | #89 | Exceptional 87.4% |
| Welsh | 97.9 /100 | #90 | Exceptional 87.4% |
| Immigrants | Eastern Asia | 97.9 /100 | #91 | Exceptional 87.4% |
| Israelis | 97.8 /100 | #92 | Exceptional 87.4% |
| Immigrants | North Macedonia | 97.8 /100 | #93 | Exceptional 87.4% |
| Immigrants | Russia | 97.8 /100 | #94 | Exceptional 87.4% |
| Immigrants | Greece | 97.7 /100 | #95 | Exceptional 87.4% |
| Czechoslovakians | 97.6 /100 | #96 | Exceptional 87.4% |
| Immigrants | Western Europe | 97.3 /100 | #97 | Exceptional 87.3% |
| Immigrants | Croatia | 96.9 /100 | #98 | Exceptional 87.3% |
Demographics Similar to Immigrants from Korea by GED/Equivalency
In terms of ged/equivalency, the demographic groups most similar to Immigrants from Korea are Australian (88.1%, a difference of 0.010%), Greek (88.1%, a difference of 0.020%), Immigrants from Latvia (88.1%, a difference of 0.030%), Immigrants from Switzerland (88.1%, a difference of 0.040%), and Czech (88.1%, a difference of 0.050%).
| Demographics | Rating | Rank | GED/Equivalency |
| Immigrants | Scotland | 99.6 /100 | #43 | Exceptional 88.2% |
| Macedonians | 99.5 /100 | #44 | Exceptional 88.1% |
| Czechs | 99.5 /100 | #45 | Exceptional 88.1% |
| Immigrants | Switzerland | 99.5 /100 | #46 | Exceptional 88.1% |
| Immigrants | Latvia | 99.5 /100 | #47 | Exceptional 88.1% |
| Greeks | 99.5 /100 | #48 | Exceptional 88.1% |
| Australians | 99.5 /100 | #49 | Exceptional 88.1% |
| Immigrants | Korea | 99.5 /100 | #50 | Exceptional 88.1% |
| Immigrants | Netherlands | 99.4 /100 | #51 | Exceptional 88.0% |
| Zimbabweans | 99.4 /100 | #52 | Exceptional 88.0% |
| Immigrants | South Africa | 99.4 /100 | #53 | Exceptional 88.0% |
| Soviet Union | 99.4 /100 | #54 | Exceptional 88.0% |
| New Zealanders | 99.4 /100 | #55 | Exceptional 88.0% |
| Immigrants | Denmark | 99.4 /100 | #56 | Exceptional 88.0% |
| Immigrants | Czechoslovakia | 99.3 /100 | #57 | Exceptional 87.9% |