Immigrants from Eastern Asia vs Subsaharan African GED/Equivalency
COMPARE
Immigrants from Eastern Asia
Subsaharan African
GED/Equivalency
GED/Equivalency Comparison
Immigrants from Eastern Asia
Sub-Saharan Africans
87.4%
GED/EQUIVALENCY
97.9/ 100
METRIC RATING
91st/ 347
METRIC RANK
84.2%
GED/EQUIVALENCY
3.0/ 100
METRIC RATING
237th/ 347
METRIC RANK
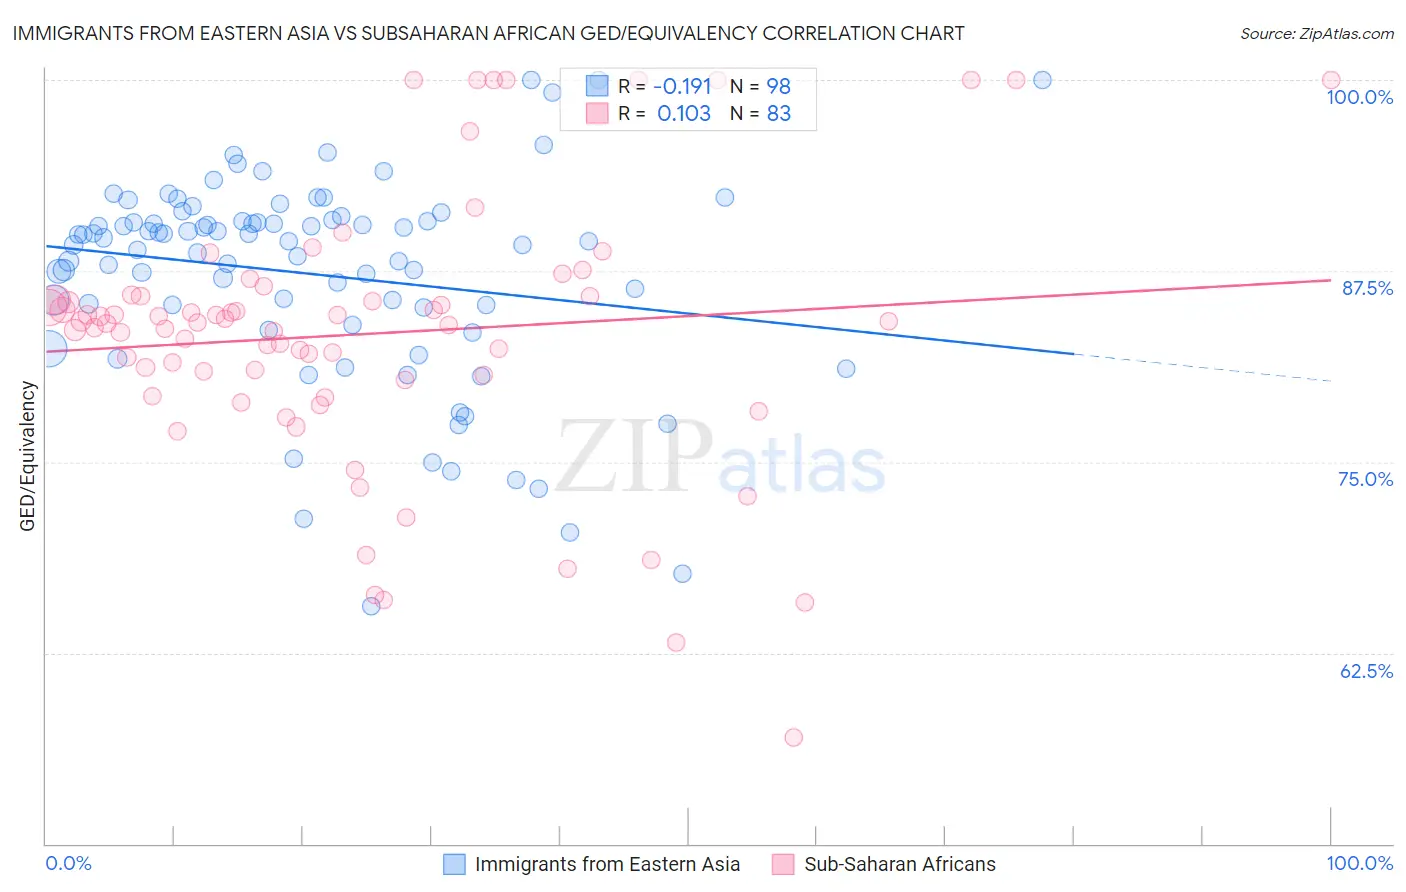
Immigrants from Eastern Asia vs Subsaharan African GED/Equivalency Correlation Chart
The statistical analysis conducted on geographies consisting of 499,846,164 people shows a poor negative correlation between the proportion of Immigrants from Eastern Asia and percentage of population with at least ged/equivalency education in the United States with a correlation coefficient (R) of -0.191 and weighted average of 87.4%. Similarly, the statistical analysis conducted on geographies consisting of 508,215,958 people shows a poor positive correlation between the proportion of Sub-Saharan Africans and percentage of population with at least ged/equivalency education in the United States with a correlation coefficient (R) of 0.103 and weighted average of 84.2%, a difference of 3.8%.
GED/Equivalency Correlation Summary
| Measurement | Immigrants from Eastern Asia | Subsaharan African |
| Minimum | 65.6% | 56.9% |
| Maximum | 100.0% | 100.0% |
| Range | 34.4% | 43.1% |
| Mean | 87.3% | 83.4% |
| Median | 89.4% | 84.2% |
| Interquartile 25% (IQ1) | 85.1% | 80.4% |
| Interquartile 75% (IQ3) | 90.8% | 85.9% |
| Interquartile Range (IQR) | 5.6% | 5.5% |
| Standard Deviation (Sample) | 6.8% | 8.8% |
| Standard Deviation (Population) | 6.8% | 8.7% |
Similar Demographics by GED/Equivalency
Demographics Similar to Immigrants from Eastern Asia by GED/Equivalency
In terms of ged/equivalency, the demographic groups most similar to Immigrants from Eastern Asia are Hungarian (87.4%, a difference of 0.010%), Welsh (87.4%, a difference of 0.010%), Israeli (87.4%, a difference of 0.010%), Immigrants from North Macedonia (87.4%, a difference of 0.020%), and Immigrants from Russia (87.4%, a difference of 0.020%).
| Demographics | Rating | Rank | GED/Equivalency |
| Immigrants | Romania | 98.1 /100 | #84 | Exceptional 87.5% |
| Dutch | 98.1 /100 | #85 | Exceptional 87.5% |
| Immigrants | Europe | 98.1 /100 | #86 | Exceptional 87.5% |
| Native Hawaiians | 98.1 /100 | #87 | Exceptional 87.5% |
| Immigrants | Norway | 98.1 /100 | #88 | Exceptional 87.5% |
| Hungarians | 97.9 /100 | #89 | Exceptional 87.4% |
| Welsh | 97.9 /100 | #90 | Exceptional 87.4% |
| Immigrants | Eastern Asia | 97.9 /100 | #91 | Exceptional 87.4% |
| Israelis | 97.8 /100 | #92 | Exceptional 87.4% |
| Immigrants | North Macedonia | 97.8 /100 | #93 | Exceptional 87.4% |
| Immigrants | Russia | 97.8 /100 | #94 | Exceptional 87.4% |
| Immigrants | Greece | 97.7 /100 | #95 | Exceptional 87.4% |
| Czechoslovakians | 97.6 /100 | #96 | Exceptional 87.4% |
| Immigrants | Western Europe | 97.3 /100 | #97 | Exceptional 87.3% |
| Immigrants | Croatia | 96.9 /100 | #98 | Exceptional 87.3% |
Demographics Similar to Sub-Saharan Africans by GED/Equivalency
In terms of ged/equivalency, the demographic groups most similar to Sub-Saharan Africans are Immigrants from Peru (84.2%, a difference of 0.060%), Ghanaian (84.3%, a difference of 0.070%), Immigrants from Eritrea (84.3%, a difference of 0.070%), Immigrants from Bahamas (84.2%, a difference of 0.090%), and Immigrants from Nigeria (84.3%, a difference of 0.10%).
| Demographics | Rating | Rank | GED/Equivalency |
| Immigrants | Colombia | 4.5 /100 | #230 | Tragic 84.4% |
| Immigrants | Middle Africa | 4.3 /100 | #231 | Tragic 84.4% |
| Immigrants | South America | 4.2 /100 | #232 | Tragic 84.4% |
| Immigrants | Panama | 4.1 /100 | #233 | Tragic 84.4% |
| Immigrants | Nigeria | 3.6 /100 | #234 | Tragic 84.3% |
| Ghanaians | 3.5 /100 | #235 | Tragic 84.3% |
| Immigrants | Eritrea | 3.5 /100 | #236 | Tragic 84.3% |
| Sub-Saharan Africans | 3.0 /100 | #237 | Tragic 84.2% |
| Immigrants | Peru | 2.7 /100 | #238 | Tragic 84.2% |
| Immigrants | Bahamas | 2.6 /100 | #239 | Tragic 84.2% |
| Immigrants | South Eastern Asia | 2.5 /100 | #240 | Tragic 84.1% |
| Senegalese | 1.9 /100 | #241 | Tragic 84.0% |
| Sri Lankans | 1.9 /100 | #242 | Tragic 84.0% |
| Cherokee | 1.3 /100 | #243 | Tragic 83.9% |
| Immigrants | Ghana | 1.3 /100 | #244 | Tragic 83.9% |