Immigrants from Costa Rica vs Menominee College, Under 1 year
COMPARE
Immigrants from Costa Rica
Menominee
College, Under 1 year
College, Under 1 year Comparison
Immigrants from Costa Rica
Menominee
63.2%
COLLEGE, UNDER 1 YEAR
4.5/ 100
METRIC RATING
223rd/ 347
METRIC RANK
57.0%
COLLEGE, UNDER 1 YEAR
0.0/ 100
METRIC RATING
316th/ 347
METRIC RANK
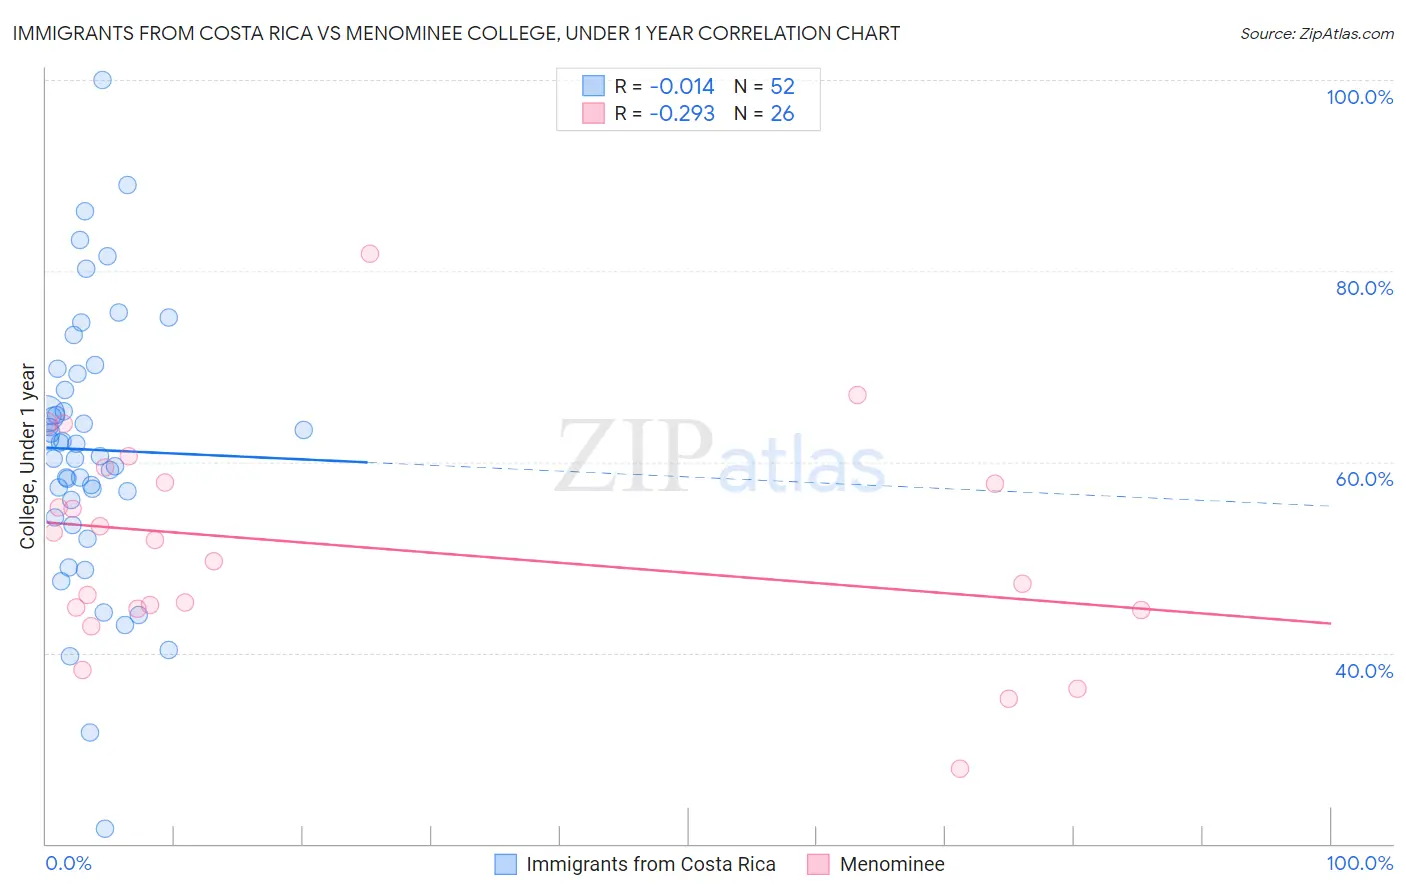
Immigrants from Costa Rica vs Menominee College, Under 1 year Correlation Chart
The statistical analysis conducted on geographies consisting of 204,277,408 people shows no correlation between the proportion of Immigrants from Costa Rica and percentage of population with at least college, under 1 year education in the United States with a correlation coefficient (R) of -0.014 and weighted average of 63.2%. Similarly, the statistical analysis conducted on geographies consisting of 45,778,979 people shows a weak negative correlation between the proportion of Menominee and percentage of population with at least college, under 1 year education in the United States with a correlation coefficient (R) of -0.293 and weighted average of 57.0%, a difference of 10.8%.
College, Under 1 year Correlation Summary
| Measurement | Immigrants from Costa Rica | Menominee |
| Minimum | 21.6% | 27.9% |
| Maximum | 100.0% | 81.8% |
| Range | 78.4% | 53.9% |
| Mean | 61.3% | 51.1% |
| Median | 61.2% | 50.7% |
| Interquartile 25% (IQ1) | 55.0% | 44.6% |
| Interquartile 75% (IQ3) | 68.4% | 57.9% |
| Interquartile Range (IQR) | 13.3% | 13.3% |
| Standard Deviation (Sample) | 14.2% | 11.5% |
| Standard Deviation (Population) | 14.1% | 11.3% |
Similar Demographics by College, Under 1 year
Demographics Similar to Immigrants from Costa Rica by College, Under 1 year
In terms of college, under 1 year, the demographic groups most similar to Immigrants from Costa Rica are Subsaharan African (63.2%, a difference of 0.030%), Immigrants from Senegal (63.3%, a difference of 0.12%), Immigrants from Peru (63.1%, a difference of 0.13%), Immigrants from Colombia (63.1%, a difference of 0.15%), and Cree (63.3%, a difference of 0.17%).
| Demographics | Rating | Rank | College, Under 1 year |
| Hmong | 6.8 /100 | #216 | Tragic 63.5% |
| Immigrants | Uruguay | 5.8 /100 | #217 | Tragic 63.4% |
| Immigrants | Panama | 5.7 /100 | #218 | Tragic 63.4% |
| Immigrants | Fiji | 5.7 /100 | #219 | Tragic 63.4% |
| Portuguese | 5.6 /100 | #220 | Tragic 63.4% |
| Cree | 5.2 /100 | #221 | Tragic 63.3% |
| Immigrants | Senegal | 5.0 /100 | #222 | Tragic 63.3% |
| Immigrants | Costa Rica | 4.5 /100 | #223 | Tragic 63.2% |
| Sub-Saharan Africans | 4.4 /100 | #224 | Tragic 63.2% |
| Immigrants | Peru | 4.0 /100 | #225 | Tragic 63.1% |
| Immigrants | Colombia | 4.0 /100 | #226 | Tragic 63.1% |
| Immigrants | Ghana | 3.7 /100 | #227 | Tragic 63.1% |
| Samoans | 3.3 /100 | #228 | Tragic 63.0% |
| Liberians | 3.2 /100 | #229 | Tragic 63.0% |
| Immigrants | Nonimmigrants | 3.0 /100 | #230 | Tragic 62.9% |
Demographics Similar to Menominee by College, Under 1 year
In terms of college, under 1 year, the demographic groups most similar to Menominee are Hispanic or Latino (57.0%, a difference of 0.040%), Honduran (57.1%, a difference of 0.050%), Hopi (57.1%, a difference of 0.10%), Immigrants from Haiti (56.9%, a difference of 0.16%), and Dutch West Indian (57.2%, a difference of 0.22%).
| Demographics | Rating | Rank | College, Under 1 year |
| Immigrants | Nicaragua | 0.0 /100 | #309 | Tragic 57.6% |
| Pueblo | 0.0 /100 | #310 | Tragic 57.4% |
| Cajuns | 0.0 /100 | #311 | Tragic 57.3% |
| Salvadorans | 0.0 /100 | #312 | Tragic 57.3% |
| Dutch West Indians | 0.0 /100 | #313 | Tragic 57.2% |
| Hopi | 0.0 /100 | #314 | Tragic 57.1% |
| Hondurans | 0.0 /100 | #315 | Tragic 57.1% |
| Menominee | 0.0 /100 | #316 | Tragic 57.0% |
| Hispanics or Latinos | 0.0 /100 | #317 | Tragic 57.0% |
| Immigrants | Haiti | 0.0 /100 | #318 | Tragic 56.9% |
| Puerto Ricans | 0.0 /100 | #319 | Tragic 56.8% |
| Guatemalans | 0.0 /100 | #320 | Tragic 56.8% |
| Natives/Alaskans | 0.0 /100 | #321 | Tragic 56.6% |
| Immigrants | Caribbean | 0.0 /100 | #322 | Tragic 56.6% |
| Immigrants | Honduras | 0.0 /100 | #323 | Tragic 56.5% |