Immigrants from Zimbabwe vs Menominee College, Under 1 year
COMPARE
Immigrants from Zimbabwe
Menominee
College, Under 1 year
College, Under 1 year Comparison
Immigrants from Zimbabwe
Menominee
68.9%
COLLEGE, UNDER 1 YEAR
99.2/ 100
METRIC RATING
67th/ 347
METRIC RANK
57.0%
COLLEGE, UNDER 1 YEAR
0.0/ 100
METRIC RATING
316th/ 347
METRIC RANK
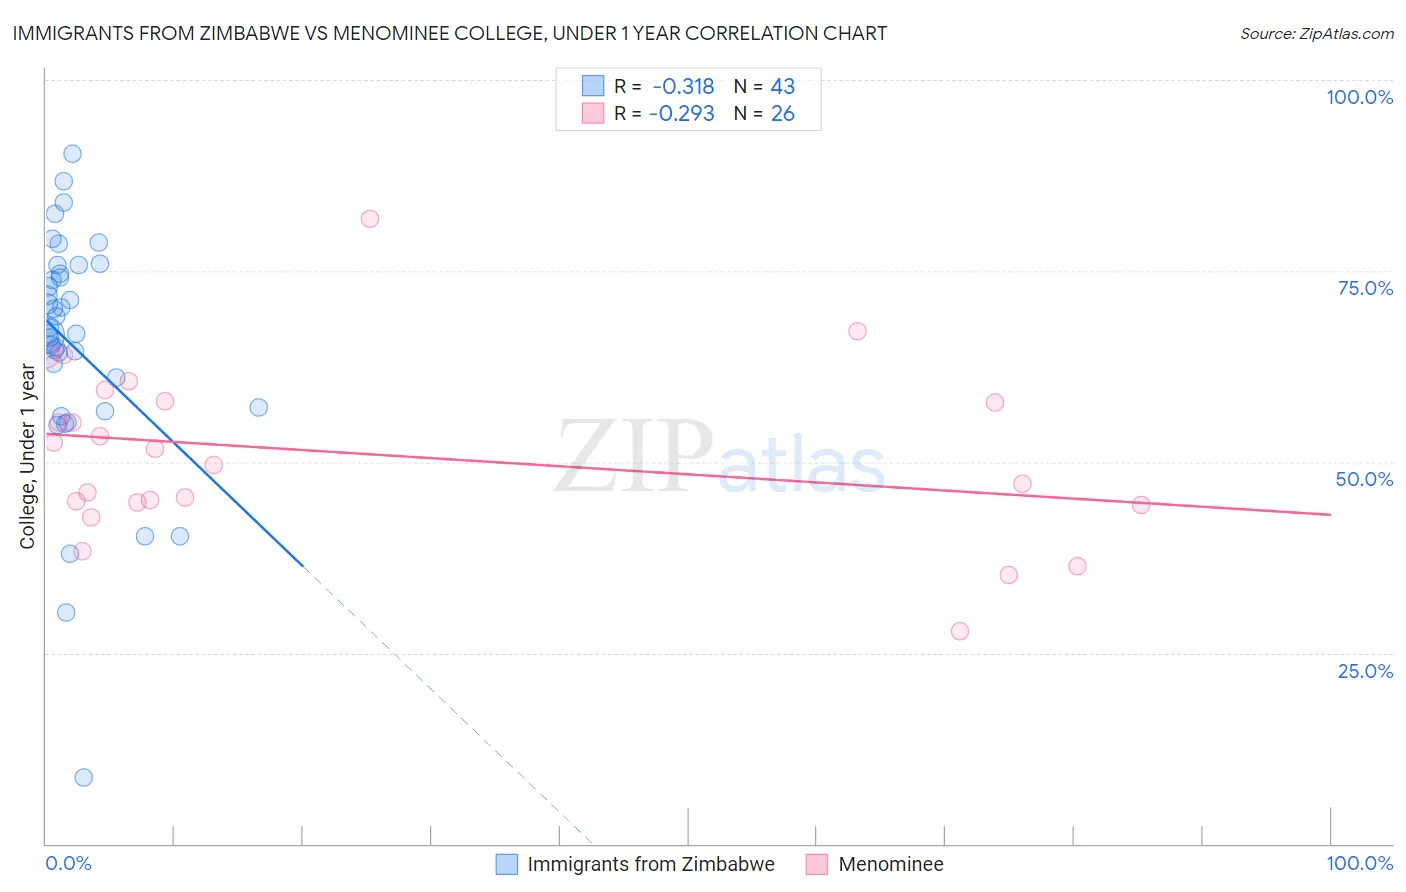
Immigrants from Zimbabwe vs Menominee College, Under 1 year Correlation Chart
The statistical analysis conducted on geographies consisting of 117,809,691 people shows a mild negative correlation between the proportion of Immigrants from Zimbabwe and percentage of population with at least college, under 1 year education in the United States with a correlation coefficient (R) of -0.318 and weighted average of 68.9%. Similarly, the statistical analysis conducted on geographies consisting of 45,778,979 people shows a weak negative correlation between the proportion of Menominee and percentage of population with at least college, under 1 year education in the United States with a correlation coefficient (R) of -0.293 and weighted average of 57.0%, a difference of 20.8%.
College, Under 1 year Correlation Summary
| Measurement | Immigrants from Zimbabwe | Menominee |
| Minimum | 8.7% | 27.9% |
| Maximum | 90.4% | 81.8% |
| Range | 81.8% | 53.9% |
| Mean | 65.1% | 51.1% |
| Median | 66.7% | 50.7% |
| Interquartile 25% (IQ1) | 57.1% | 44.6% |
| Interquartile 75% (IQ3) | 74.7% | 57.9% |
| Interquartile Range (IQR) | 17.5% | 13.3% |
| Standard Deviation (Sample) | 15.5% | 11.5% |
| Standard Deviation (Population) | 15.3% | 11.3% |
Similar Demographics by College, Under 1 year
Demographics Similar to Immigrants from Zimbabwe by College, Under 1 year
In terms of college, under 1 year, the demographic groups most similar to Immigrants from Zimbabwe are Immigrants from Indonesia (68.9%, a difference of 0.030%), Immigrants from Romania (68.9%, a difference of 0.050%), Immigrants from North America (69.0%, a difference of 0.14%), Immigrants from Moldova (69.0%, a difference of 0.17%), and Northern European (69.0%, a difference of 0.18%).
| Demographics | Rating | Rank | College, Under 1 year |
| Immigrants | Asia | 99.5 /100 | #60 | Exceptional 69.2% |
| Immigrants | Kazakhstan | 99.5 /100 | #61 | Exceptional 69.2% |
| Immigrants | Belarus | 99.5 /100 | #62 | Exceptional 69.2% |
| Immigrants | Canada | 99.4 /100 | #63 | Exceptional 69.1% |
| Northern Europeans | 99.4 /100 | #64 | Exceptional 69.0% |
| Immigrants | Moldova | 99.3 /100 | #65 | Exceptional 69.0% |
| Immigrants | North America | 99.3 /100 | #66 | Exceptional 69.0% |
| Immigrants | Zimbabwe | 99.2 /100 | #67 | Exceptional 68.9% |
| Immigrants | Indonesia | 99.2 /100 | #68 | Exceptional 68.9% |
| Immigrants | Romania | 99.2 /100 | #69 | Exceptional 68.9% |
| Lithuanians | 99.1 /100 | #70 | Exceptional 68.8% |
| Immigrants | Europe | 99.1 /100 | #71 | Exceptional 68.8% |
| Bolivians | 99.0 /100 | #72 | Exceptional 68.7% |
| Immigrants | England | 99.0 /100 | #73 | Exceptional 68.7% |
| Swedes | 98.9 /100 | #74 | Exceptional 68.7% |
Demographics Similar to Menominee by College, Under 1 year
In terms of college, under 1 year, the demographic groups most similar to Menominee are Hispanic or Latino (57.0%, a difference of 0.040%), Honduran (57.1%, a difference of 0.050%), Hopi (57.1%, a difference of 0.10%), Immigrants from Haiti (56.9%, a difference of 0.16%), and Dutch West Indian (57.2%, a difference of 0.22%).
| Demographics | Rating | Rank | College, Under 1 year |
| Immigrants | Nicaragua | 0.0 /100 | #309 | Tragic 57.6% |
| Pueblo | 0.0 /100 | #310 | Tragic 57.4% |
| Cajuns | 0.0 /100 | #311 | Tragic 57.3% |
| Salvadorans | 0.0 /100 | #312 | Tragic 57.3% |
| Dutch West Indians | 0.0 /100 | #313 | Tragic 57.2% |
| Hopi | 0.0 /100 | #314 | Tragic 57.1% |
| Hondurans | 0.0 /100 | #315 | Tragic 57.1% |
| Menominee | 0.0 /100 | #316 | Tragic 57.0% |
| Hispanics or Latinos | 0.0 /100 | #317 | Tragic 57.0% |
| Immigrants | Haiti | 0.0 /100 | #318 | Tragic 56.9% |
| Puerto Ricans | 0.0 /100 | #319 | Tragic 56.8% |
| Guatemalans | 0.0 /100 | #320 | Tragic 56.8% |
| Natives/Alaskans | 0.0 /100 | #321 | Tragic 56.6% |
| Immigrants | Caribbean | 0.0 /100 | #322 | Tragic 56.6% |
| Immigrants | Honduras | 0.0 /100 | #323 | Tragic 56.5% |