Immigrants from Costa Rica vs Immigrants from Vietnam College, Under 1 year
COMPARE
Immigrants from Costa Rica
Immigrants from Vietnam
College, Under 1 year
College, Under 1 year Comparison
Immigrants from Costa Rica
Immigrants from Vietnam
63.2%
COLLEGE, UNDER 1 YEAR
4.5/ 100
METRIC RATING
223rd/ 347
METRIC RANK
64.0%
COLLEGE, UNDER 1 YEAR
12.1/ 100
METRIC RATING
208th/ 347
METRIC RANK
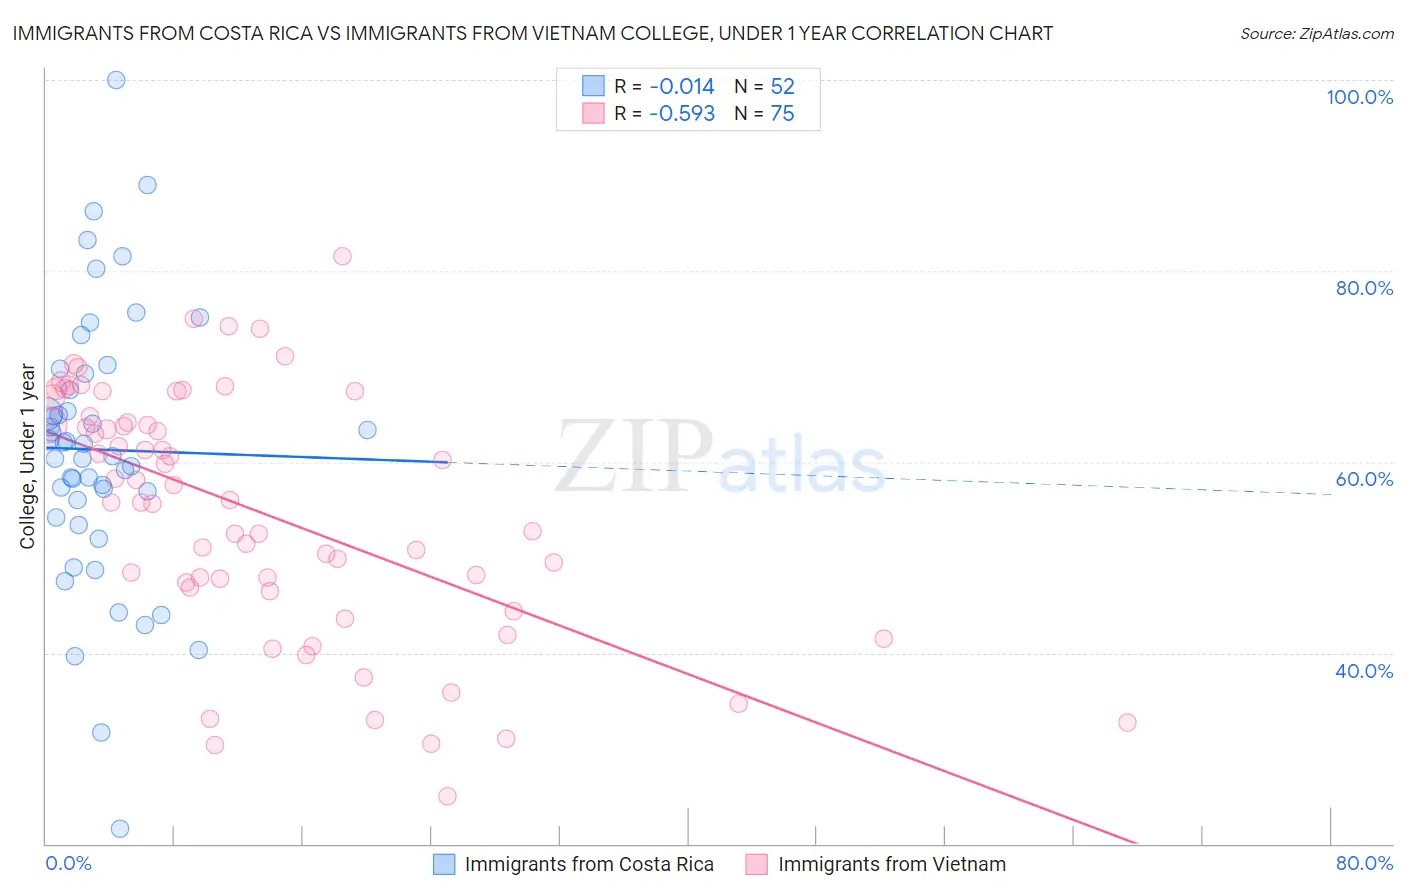
Immigrants from Costa Rica vs Immigrants from Vietnam College, Under 1 year Correlation Chart
The statistical analysis conducted on geographies consisting of 204,277,408 people shows no correlation between the proportion of Immigrants from Costa Rica and percentage of population with at least college, under 1 year education in the United States with a correlation coefficient (R) of -0.014 and weighted average of 63.2%. Similarly, the statistical analysis conducted on geographies consisting of 404,840,202 people shows a substantial negative correlation between the proportion of Immigrants from Vietnam and percentage of population with at least college, under 1 year education in the United States with a correlation coefficient (R) of -0.593 and weighted average of 64.0%, a difference of 1.2%.
College, Under 1 year Correlation Summary
| Measurement | Immigrants from Costa Rica | Immigrants from Vietnam |
| Minimum | 21.6% | 25.0% |
| Maximum | 100.0% | 81.5% |
| Range | 78.4% | 56.5% |
| Mean | 61.3% | 54.8% |
| Median | 61.2% | 56.0% |
| Interquartile 25% (IQ1) | 55.0% | 46.8% |
| Interquartile 75% (IQ3) | 68.4% | 64.8% |
| Interquartile Range (IQR) | 13.3% | 17.9% |
| Standard Deviation (Sample) | 14.2% | 12.9% |
| Standard Deviation (Population) | 14.1% | 12.8% |
Demographics Similar to Immigrants from Costa Rica and Immigrants from Vietnam by College, Under 1 year
In terms of college, under 1 year, the demographic groups most similar to Immigrants from Costa Rica are Subsaharan African (63.2%, a difference of 0.030%), Immigrants from Senegal (63.3%, a difference of 0.12%), Immigrants from Peru (63.1%, a difference of 0.13%), Cree (63.3%, a difference of 0.17%), and Portuguese (63.4%, a difference of 0.26%). Similarly, the demographic groups most similar to Immigrants from Vietnam are Colombian (64.0%, a difference of 0.030%), White/Caucasian (64.0%, a difference of 0.070%), Puget Sound Salish (63.9%, a difference of 0.090%), Ghanaian (63.9%, a difference of 0.10%), and Peruvian (64.1%, a difference of 0.16%).
| Demographics | Rating | Rank | College, Under 1 year |
| Peruvians | 13.7 /100 | #205 | Poor 64.1% |
| Whites/Caucasians | 12.8 /100 | #206 | Poor 64.0% |
| Colombians | 12.4 /100 | #207 | Poor 64.0% |
| Immigrants | Vietnam | 12.1 /100 | #208 | Poor 64.0% |
| Puget Sound Salish | 11.3 /100 | #209 | Poor 63.9% |
| Ghanaians | 11.2 /100 | #210 | Poor 63.9% |
| Native Hawaiians | 10.6 /100 | #211 | Poor 63.9% |
| Immigrants | Middle Africa | 10.5 /100 | #212 | Poor 63.9% |
| Immigrants | South America | 9.1 /100 | #213 | Tragic 63.8% |
| Immigrants | Nigeria | 8.8 /100 | #214 | Tragic 63.7% |
| Senegalese | 7.7 /100 | #215 | Tragic 63.6% |
| Hmong | 6.8 /100 | #216 | Tragic 63.5% |
| Immigrants | Uruguay | 5.8 /100 | #217 | Tragic 63.4% |
| Immigrants | Panama | 5.7 /100 | #218 | Tragic 63.4% |
| Immigrants | Fiji | 5.7 /100 | #219 | Tragic 63.4% |
| Portuguese | 5.6 /100 | #220 | Tragic 63.4% |
| Cree | 5.2 /100 | #221 | Tragic 63.3% |
| Immigrants | Senegal | 5.0 /100 | #222 | Tragic 63.3% |
| Immigrants | Costa Rica | 4.5 /100 | #223 | Tragic 63.2% |
| Sub-Saharan Africans | 4.4 /100 | #224 | Tragic 63.2% |
| Immigrants | Peru | 4.0 /100 | #225 | Tragic 63.1% |