Immigrants from Belize vs Menominee College, Under 1 year
COMPARE
Immigrants from Belize
Menominee
College, Under 1 year
College, Under 1 year Comparison
Immigrants from Belize
Menominee
59.1%
COLLEGE, UNDER 1 YEAR
0.0/ 100
METRIC RATING
294th/ 347
METRIC RANK
57.0%
COLLEGE, UNDER 1 YEAR
0.0/ 100
METRIC RATING
316th/ 347
METRIC RANK
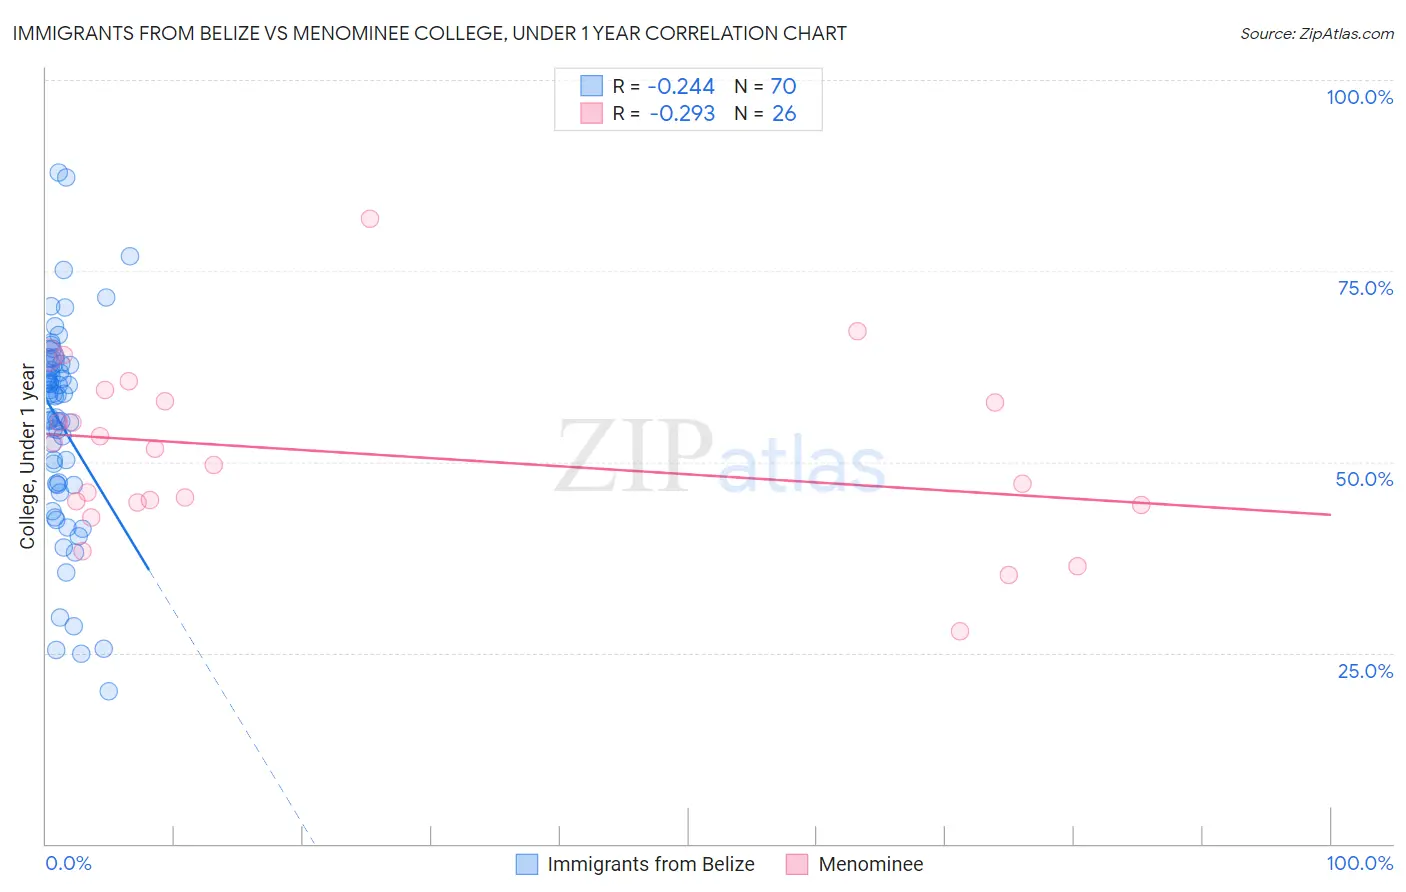
Immigrants from Belize vs Menominee College, Under 1 year Correlation Chart
The statistical analysis conducted on geographies consisting of 130,329,081 people shows a weak negative correlation between the proportion of Immigrants from Belize and percentage of population with at least college, under 1 year education in the United States with a correlation coefficient (R) of -0.244 and weighted average of 59.1%. Similarly, the statistical analysis conducted on geographies consisting of 45,778,979 people shows a weak negative correlation between the proportion of Menominee and percentage of population with at least college, under 1 year education in the United States with a correlation coefficient (R) of -0.293 and weighted average of 57.0%, a difference of 3.7%.
College, Under 1 year Correlation Summary
| Measurement | Immigrants from Belize | Menominee |
| Minimum | 19.9% | 27.9% |
| Maximum | 87.9% | 81.8% |
| Range | 68.0% | 53.9% |
| Mean | 54.9% | 51.1% |
| Median | 58.7% | 50.7% |
| Interquartile 25% (IQ1) | 47.0% | 44.6% |
| Interquartile 75% (IQ3) | 62.9% | 57.9% |
| Interquartile Range (IQR) | 15.9% | 13.3% |
| Standard Deviation (Sample) | 13.7% | 11.5% |
| Standard Deviation (Population) | 13.6% | 11.3% |
Similar Demographics by College, Under 1 year
Demographics Similar to Immigrants from Belize by College, Under 1 year
In terms of college, under 1 year, the demographic groups most similar to Immigrants from Belize are Seminole (59.1%, a difference of 0.020%), Immigrants from Grenada (59.1%, a difference of 0.10%), Central American Indian (59.0%, a difference of 0.14%), Guyanese (59.0%, a difference of 0.19%), and Nicaraguan (59.2%, a difference of 0.20%).
| Demographics | Rating | Rank | College, Under 1 year |
| Sioux | 0.0 /100 | #287 | Tragic 59.4% |
| Blacks/African Americans | 0.0 /100 | #288 | Tragic 59.4% |
| Choctaw | 0.0 /100 | #289 | Tragic 59.3% |
| Ecuadorians | 0.0 /100 | #290 | Tragic 59.3% |
| Creek | 0.0 /100 | #291 | Tragic 59.3% |
| Nicaraguans | 0.0 /100 | #292 | Tragic 59.2% |
| Seminole | 0.0 /100 | #293 | Tragic 59.1% |
| Immigrants | Belize | 0.0 /100 | #294 | Tragic 59.1% |
| Immigrants | Grenada | 0.0 /100 | #295 | Tragic 59.1% |
| Central American Indians | 0.0 /100 | #296 | Tragic 59.0% |
| Guyanese | 0.0 /100 | #297 | Tragic 59.0% |
| Immigrants | Ecuador | 0.0 /100 | #298 | Tragic 58.7% |
| Cubans | 0.0 /100 | #299 | Tragic 58.6% |
| Immigrants | Guyana | 0.0 /100 | #300 | Tragic 58.5% |
| Mexican American Indians | 0.0 /100 | #301 | Tragic 58.1% |
Demographics Similar to Menominee by College, Under 1 year
In terms of college, under 1 year, the demographic groups most similar to Menominee are Hispanic or Latino (57.0%, a difference of 0.040%), Honduran (57.1%, a difference of 0.050%), Hopi (57.1%, a difference of 0.10%), Immigrants from Haiti (56.9%, a difference of 0.16%), and Dutch West Indian (57.2%, a difference of 0.22%).
| Demographics | Rating | Rank | College, Under 1 year |
| Immigrants | Nicaragua | 0.0 /100 | #309 | Tragic 57.6% |
| Pueblo | 0.0 /100 | #310 | Tragic 57.4% |
| Cajuns | 0.0 /100 | #311 | Tragic 57.3% |
| Salvadorans | 0.0 /100 | #312 | Tragic 57.3% |
| Dutch West Indians | 0.0 /100 | #313 | Tragic 57.2% |
| Hopi | 0.0 /100 | #314 | Tragic 57.1% |
| Hondurans | 0.0 /100 | #315 | Tragic 57.1% |
| Menominee | 0.0 /100 | #316 | Tragic 57.0% |
| Hispanics or Latinos | 0.0 /100 | #317 | Tragic 57.0% |
| Immigrants | Haiti | 0.0 /100 | #318 | Tragic 56.9% |
| Puerto Ricans | 0.0 /100 | #319 | Tragic 56.8% |
| Guatemalans | 0.0 /100 | #320 | Tragic 56.8% |
| Natives/Alaskans | 0.0 /100 | #321 | Tragic 56.6% |
| Immigrants | Caribbean | 0.0 /100 | #322 | Tragic 56.6% |
| Immigrants | Honduras | 0.0 /100 | #323 | Tragic 56.5% |