Immigrants from Costa Rica vs Immigrants from North America College, Under 1 year
COMPARE
Immigrants from Costa Rica
Immigrants from North America
College, Under 1 year
College, Under 1 year Comparison
Immigrants from Costa Rica
Immigrants from North America
63.2%
COLLEGE, UNDER 1 YEAR
4.5/ 100
METRIC RATING
223rd/ 347
METRIC RANK
69.0%
COLLEGE, UNDER 1 YEAR
99.3/ 100
METRIC RATING
66th/ 347
METRIC RANK
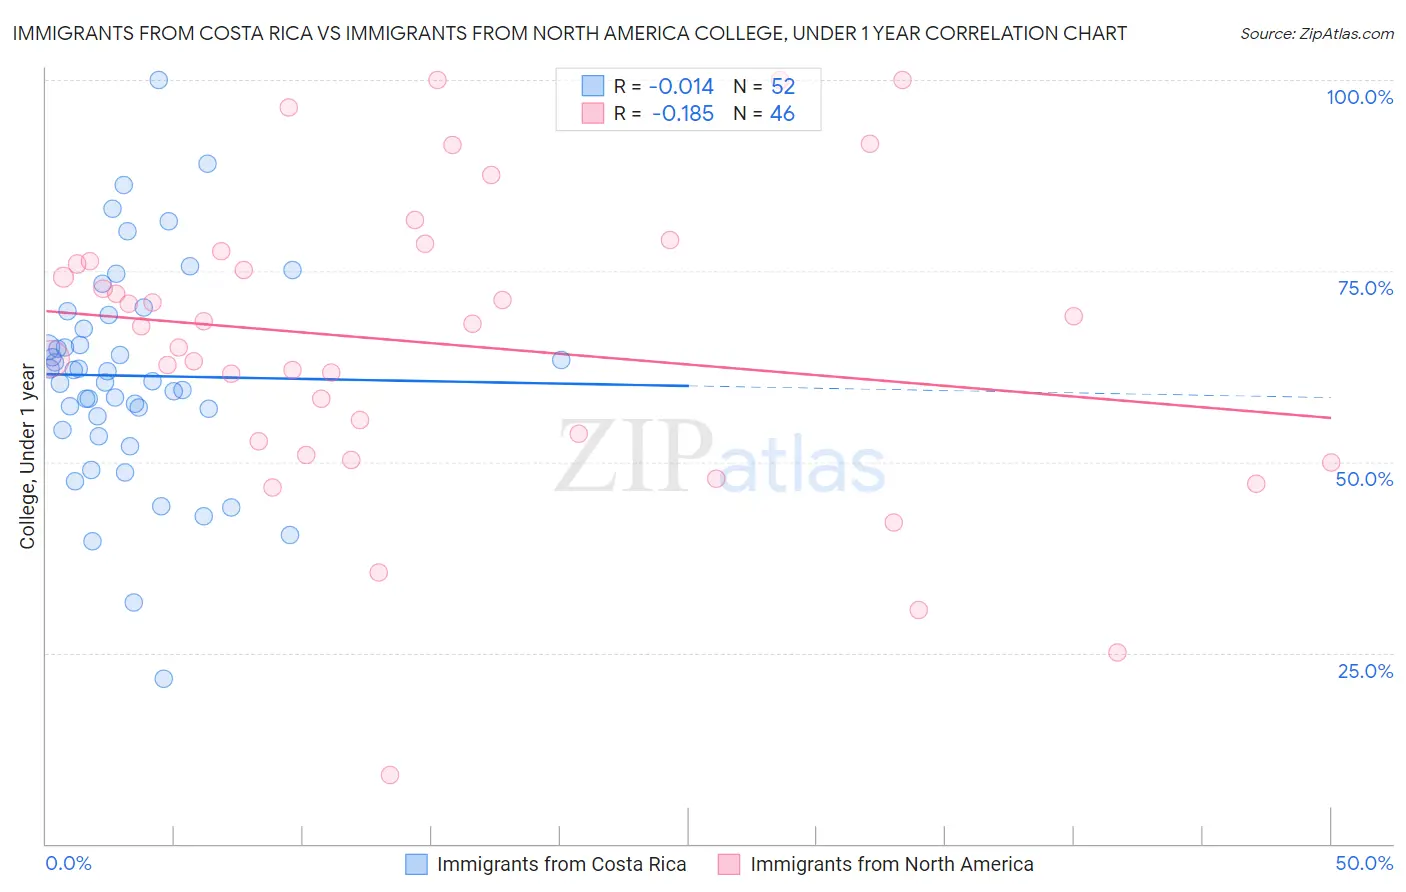
Immigrants from Costa Rica vs Immigrants from North America College, Under 1 year Correlation Chart
The statistical analysis conducted on geographies consisting of 204,277,408 people shows no correlation between the proportion of Immigrants from Costa Rica and percentage of population with at least college, under 1 year education in the United States with a correlation coefficient (R) of -0.014 and weighted average of 63.2%. Similarly, the statistical analysis conducted on geographies consisting of 462,457,398 people shows a poor negative correlation between the proportion of Immigrants from North America and percentage of population with at least college, under 1 year education in the United States with a correlation coefficient (R) of -0.185 and weighted average of 69.0%, a difference of 9.2%.
College, Under 1 year Correlation Summary
| Measurement | Immigrants from Costa Rica | Immigrants from North America |
| Minimum | 21.6% | 9.0% |
| Maximum | 100.0% | 100.0% |
| Range | 78.4% | 91.0% |
| Mean | 61.3% | 65.5% |
| Median | 61.2% | 67.9% |
| Interquartile 25% (IQ1) | 55.0% | 52.7% |
| Interquartile 75% (IQ3) | 68.4% | 76.3% |
| Interquartile Range (IQR) | 13.3% | 23.6% |
| Standard Deviation (Sample) | 14.2% | 19.7% |
| Standard Deviation (Population) | 14.1% | 19.5% |
Similar Demographics by College, Under 1 year
Demographics Similar to Immigrants from Costa Rica by College, Under 1 year
In terms of college, under 1 year, the demographic groups most similar to Immigrants from Costa Rica are Subsaharan African (63.2%, a difference of 0.030%), Immigrants from Senegal (63.3%, a difference of 0.12%), Immigrants from Peru (63.1%, a difference of 0.13%), Immigrants from Colombia (63.1%, a difference of 0.15%), and Cree (63.3%, a difference of 0.17%).
| Demographics | Rating | Rank | College, Under 1 year |
| Hmong | 6.8 /100 | #216 | Tragic 63.5% |
| Immigrants | Uruguay | 5.8 /100 | #217 | Tragic 63.4% |
| Immigrants | Panama | 5.7 /100 | #218 | Tragic 63.4% |
| Immigrants | Fiji | 5.7 /100 | #219 | Tragic 63.4% |
| Portuguese | 5.6 /100 | #220 | Tragic 63.4% |
| Cree | 5.2 /100 | #221 | Tragic 63.3% |
| Immigrants | Senegal | 5.0 /100 | #222 | Tragic 63.3% |
| Immigrants | Costa Rica | 4.5 /100 | #223 | Tragic 63.2% |
| Sub-Saharan Africans | 4.4 /100 | #224 | Tragic 63.2% |
| Immigrants | Peru | 4.0 /100 | #225 | Tragic 63.1% |
| Immigrants | Colombia | 4.0 /100 | #226 | Tragic 63.1% |
| Immigrants | Ghana | 3.7 /100 | #227 | Tragic 63.1% |
| Samoans | 3.3 /100 | #228 | Tragic 63.0% |
| Liberians | 3.2 /100 | #229 | Tragic 63.0% |
| Immigrants | Nonimmigrants | 3.0 /100 | #230 | Tragic 62.9% |
Demographics Similar to Immigrants from North America by College, Under 1 year
In terms of college, under 1 year, the demographic groups most similar to Immigrants from North America are Immigrants from Moldova (69.0%, a difference of 0.030%), Northern European (69.0%, a difference of 0.040%), Immigrants from Canada (69.1%, a difference of 0.080%), Immigrants from Zimbabwe (68.9%, a difference of 0.14%), and Immigrants from Indonesia (68.9%, a difference of 0.17%).
| Demographics | Rating | Rank | College, Under 1 year |
| Immigrants | Serbia | 99.5 /100 | #59 | Exceptional 69.3% |
| Immigrants | Asia | 99.5 /100 | #60 | Exceptional 69.2% |
| Immigrants | Kazakhstan | 99.5 /100 | #61 | Exceptional 69.2% |
| Immigrants | Belarus | 99.5 /100 | #62 | Exceptional 69.2% |
| Immigrants | Canada | 99.4 /100 | #63 | Exceptional 69.1% |
| Northern Europeans | 99.4 /100 | #64 | Exceptional 69.0% |
| Immigrants | Moldova | 99.3 /100 | #65 | Exceptional 69.0% |
| Immigrants | North America | 99.3 /100 | #66 | Exceptional 69.0% |
| Immigrants | Zimbabwe | 99.2 /100 | #67 | Exceptional 68.9% |
| Immigrants | Indonesia | 99.2 /100 | #68 | Exceptional 68.9% |
| Immigrants | Romania | 99.2 /100 | #69 | Exceptional 68.9% |
| Lithuanians | 99.1 /100 | #70 | Exceptional 68.8% |
| Immigrants | Europe | 99.1 /100 | #71 | Exceptional 68.8% |
| Bolivians | 99.0 /100 | #72 | Exceptional 68.7% |
| Immigrants | England | 99.0 /100 | #73 | Exceptional 68.7% |