Immigrants from Costa Rica vs Yuman College, Under 1 year
COMPARE
Immigrants from Costa Rica
Yuman
College, Under 1 year
College, Under 1 year Comparison
Immigrants from Costa Rica
Yuman
63.2%
COLLEGE, UNDER 1 YEAR
4.5/ 100
METRIC RATING
223rd/ 347
METRIC RANK
55.1%
COLLEGE, UNDER 1 YEAR
0.0/ 100
METRIC RATING
333rd/ 347
METRIC RANK
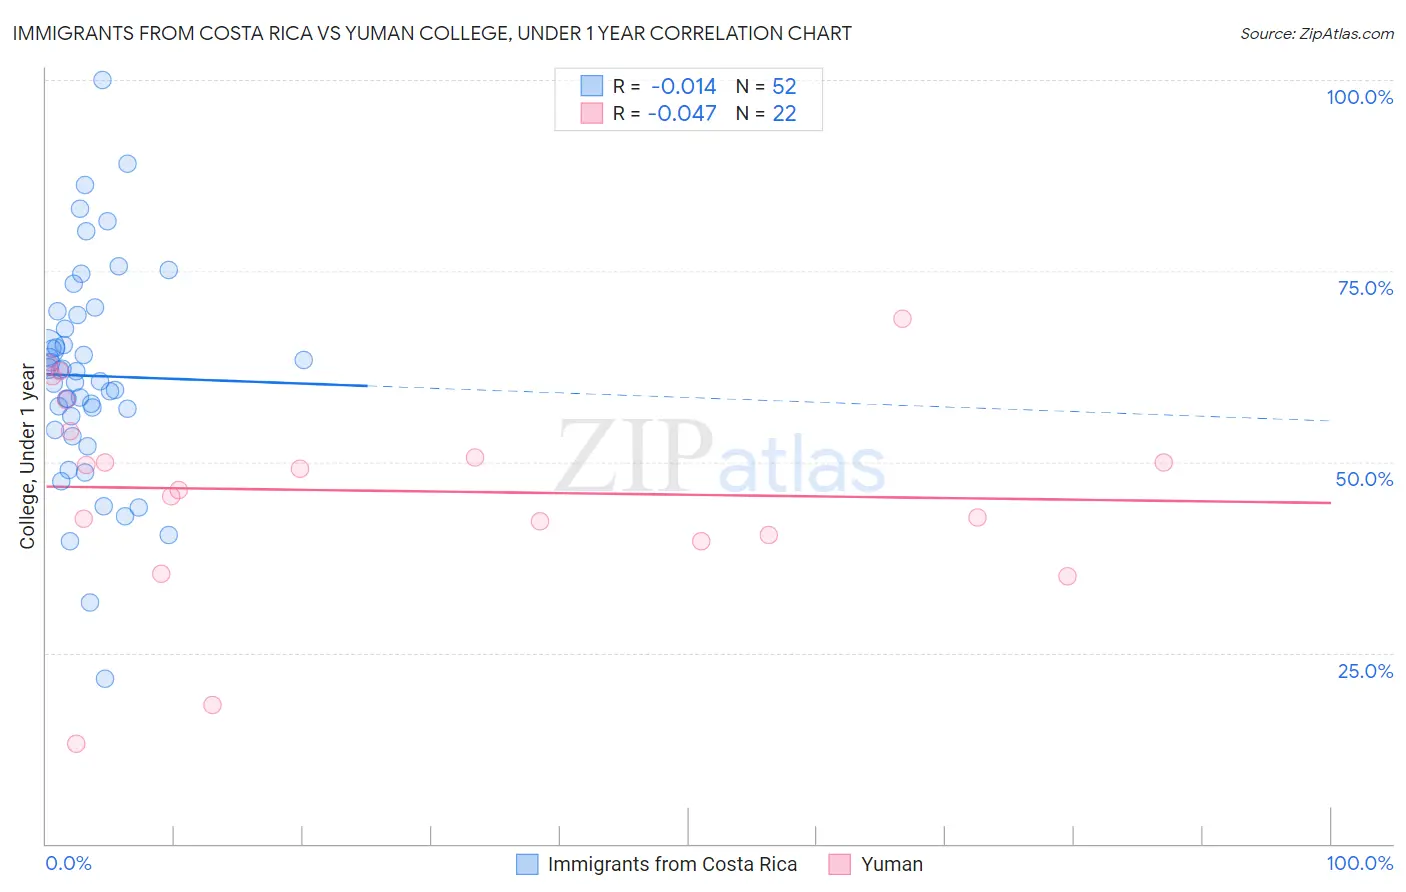
Immigrants from Costa Rica vs Yuman College, Under 1 year Correlation Chart
The statistical analysis conducted on geographies consisting of 204,277,408 people shows no correlation between the proportion of Immigrants from Costa Rica and percentage of population with at least college, under 1 year education in the United States with a correlation coefficient (R) of -0.014 and weighted average of 63.2%. Similarly, the statistical analysis conducted on geographies consisting of 40,696,202 people shows no correlation between the proportion of Yuman and percentage of population with at least college, under 1 year education in the United States with a correlation coefficient (R) of -0.047 and weighted average of 55.1%, a difference of 14.8%.
College, Under 1 year Correlation Summary
| Measurement | Immigrants from Costa Rica | Yuman |
| Minimum | 21.6% | 13.1% |
| Maximum | 100.0% | 68.8% |
| Range | 78.4% | 55.7% |
| Mean | 61.3% | 46.2% |
| Median | 61.2% | 47.7% |
| Interquartile 25% (IQ1) | 55.0% | 40.4% |
| Interquartile 75% (IQ3) | 68.4% | 54.0% |
| Interquartile Range (IQR) | 13.3% | 13.5% |
| Standard Deviation (Sample) | 14.2% | 13.4% |
| Standard Deviation (Population) | 14.1% | 13.1% |
Similar Demographics by College, Under 1 year
Demographics Similar to Immigrants from Costa Rica by College, Under 1 year
In terms of college, under 1 year, the demographic groups most similar to Immigrants from Costa Rica are Subsaharan African (63.2%, a difference of 0.030%), Immigrants from Senegal (63.3%, a difference of 0.12%), Immigrants from Peru (63.1%, a difference of 0.13%), Immigrants from Colombia (63.1%, a difference of 0.15%), and Cree (63.3%, a difference of 0.17%).
| Demographics | Rating | Rank | College, Under 1 year |
| Hmong | 6.8 /100 | #216 | Tragic 63.5% |
| Immigrants | Uruguay | 5.8 /100 | #217 | Tragic 63.4% |
| Immigrants | Panama | 5.7 /100 | #218 | Tragic 63.4% |
| Immigrants | Fiji | 5.7 /100 | #219 | Tragic 63.4% |
| Portuguese | 5.6 /100 | #220 | Tragic 63.4% |
| Cree | 5.2 /100 | #221 | Tragic 63.3% |
| Immigrants | Senegal | 5.0 /100 | #222 | Tragic 63.3% |
| Immigrants | Costa Rica | 4.5 /100 | #223 | Tragic 63.2% |
| Sub-Saharan Africans | 4.4 /100 | #224 | Tragic 63.2% |
| Immigrants | Peru | 4.0 /100 | #225 | Tragic 63.1% |
| Immigrants | Colombia | 4.0 /100 | #226 | Tragic 63.1% |
| Immigrants | Ghana | 3.7 /100 | #227 | Tragic 63.1% |
| Samoans | 3.3 /100 | #228 | Tragic 63.0% |
| Liberians | 3.2 /100 | #229 | Tragic 63.0% |
| Immigrants | Nonimmigrants | 3.0 /100 | #230 | Tragic 62.9% |
Demographics Similar to Yuman by College, Under 1 year
In terms of college, under 1 year, the demographic groups most similar to Yuman are Immigrants from Yemen (55.3%, a difference of 0.32%), Immigrants from the Azores (54.7%, a difference of 0.72%), Dominican (55.5%, a difference of 0.73%), Inupiat (54.6%, a difference of 0.85%), and Mexican (55.6%, a difference of 0.99%).
| Demographics | Rating | Rank | College, Under 1 year |
| Navajo | 0.0 /100 | #326 | Tragic 56.3% |
| Immigrants | Guatemala | 0.0 /100 | #327 | Tragic 56.2% |
| Cape Verdeans | 0.0 /100 | #328 | Tragic 56.0% |
| Immigrants | Cuba | 0.0 /100 | #329 | Tragic 55.7% |
| Mexicans | 0.0 /100 | #330 | Tragic 55.6% |
| Dominicans | 0.0 /100 | #331 | Tragic 55.5% |
| Immigrants | Yemen | 0.0 /100 | #332 | Tragic 55.3% |
| Yuman | 0.0 /100 | #333 | Tragic 55.1% |
| Immigrants | Azores | 0.0 /100 | #334 | Tragic 54.7% |
| Inupiat | 0.0 /100 | #335 | Tragic 54.6% |
| Pennsylvania Germans | 0.0 /100 | #336 | Tragic 54.5% |
| Immigrants | Central America | 0.0 /100 | #337 | Tragic 54.4% |
| Lumbee | 0.0 /100 | #338 | Tragic 54.2% |
| Immigrants | Dominican Republic | 0.0 /100 | #339 | Tragic 54.0% |
| Spanish American Indians | 0.0 /100 | #340 | Tragic 54.0% |