Immigrants from Costa Rica vs Senegalese College, Under 1 year
COMPARE
Immigrants from Costa Rica
Senegalese
College, Under 1 year
College, Under 1 year Comparison
Immigrants from Costa Rica
Senegalese
63.2%
COLLEGE, UNDER 1 YEAR
4.5/ 100
METRIC RATING
223rd/ 347
METRIC RANK
63.6%
COLLEGE, UNDER 1 YEAR
7.7/ 100
METRIC RATING
215th/ 347
METRIC RANK
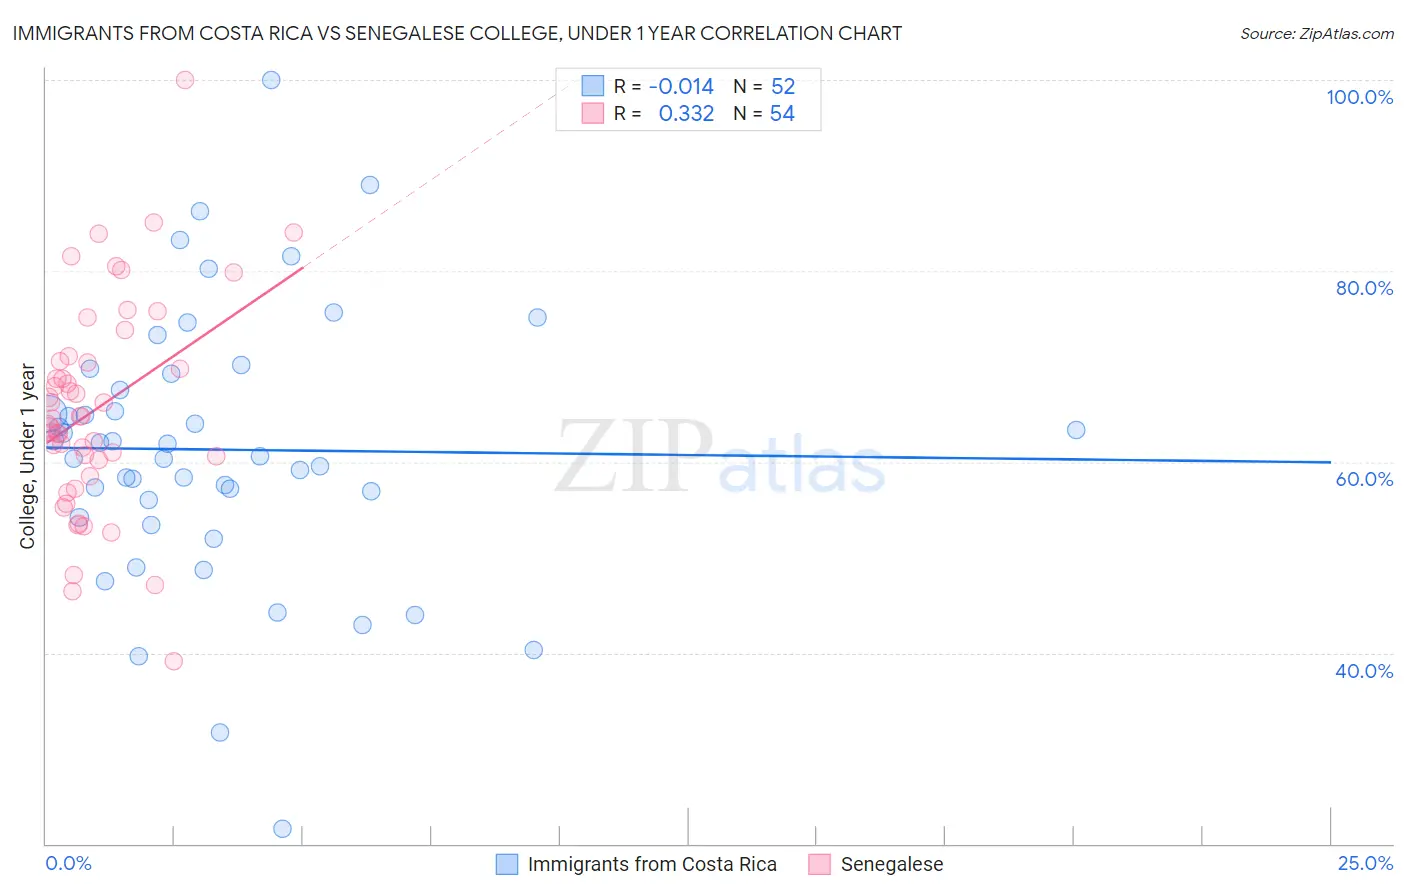
Immigrants from Costa Rica vs Senegalese College, Under 1 year Correlation Chart
The statistical analysis conducted on geographies consisting of 204,277,408 people shows no correlation between the proportion of Immigrants from Costa Rica and percentage of population with at least college, under 1 year education in the United States with a correlation coefficient (R) of -0.014 and weighted average of 63.2%. Similarly, the statistical analysis conducted on geographies consisting of 78,142,569 people shows a mild positive correlation between the proportion of Senegalese and percentage of population with at least college, under 1 year education in the United States with a correlation coefficient (R) of 0.332 and weighted average of 63.6%, a difference of 0.65%.
College, Under 1 year Correlation Summary
| Measurement | Immigrants from Costa Rica | Senegalese |
| Minimum | 21.6% | 39.1% |
| Maximum | 100.0% | 100.0% |
| Range | 78.4% | 60.9% |
| Mean | 61.3% | 65.6% |
| Median | 61.2% | 64.7% |
| Interquartile 25% (IQ1) | 55.0% | 60.2% |
| Interquartile 75% (IQ3) | 68.4% | 70.5% |
| Interquartile Range (IQR) | 13.3% | 10.4% |
| Standard Deviation (Sample) | 14.2% | 11.1% |
| Standard Deviation (Population) | 14.1% | 11.0% |
Demographics Similar to Immigrants from Costa Rica and Senegalese by College, Under 1 year
In terms of college, under 1 year, the demographic groups most similar to Immigrants from Costa Rica are Subsaharan African (63.2%, a difference of 0.030%), Immigrants from Senegal (63.3%, a difference of 0.12%), Immigrants from Peru (63.1%, a difference of 0.13%), Immigrants from Colombia (63.1%, a difference of 0.15%), and Cree (63.3%, a difference of 0.17%). Similarly, the demographic groups most similar to Senegalese are Hmong (63.5%, a difference of 0.15%), Immigrants from Nigeria (63.7%, a difference of 0.17%), Immigrants from South America (63.8%, a difference of 0.21%), Immigrants from Uruguay (63.4%, a difference of 0.34%), and Immigrants from Panama (63.4%, a difference of 0.36%).
| Demographics | Rating | Rank | College, Under 1 year |
| Puget Sound Salish | 11.3 /100 | #209 | Poor 63.9% |
| Ghanaians | 11.2 /100 | #210 | Poor 63.9% |
| Native Hawaiians | 10.6 /100 | #211 | Poor 63.9% |
| Immigrants | Middle Africa | 10.5 /100 | #212 | Poor 63.9% |
| Immigrants | South America | 9.1 /100 | #213 | Tragic 63.8% |
| Immigrants | Nigeria | 8.8 /100 | #214 | Tragic 63.7% |
| Senegalese | 7.7 /100 | #215 | Tragic 63.6% |
| Hmong | 6.8 /100 | #216 | Tragic 63.5% |
| Immigrants | Uruguay | 5.8 /100 | #217 | Tragic 63.4% |
| Immigrants | Panama | 5.7 /100 | #218 | Tragic 63.4% |
| Immigrants | Fiji | 5.7 /100 | #219 | Tragic 63.4% |
| Portuguese | 5.6 /100 | #220 | Tragic 63.4% |
| Cree | 5.2 /100 | #221 | Tragic 63.3% |
| Immigrants | Senegal | 5.0 /100 | #222 | Tragic 63.3% |
| Immigrants | Costa Rica | 4.5 /100 | #223 | Tragic 63.2% |
| Sub-Saharan Africans | 4.4 /100 | #224 | Tragic 63.2% |
| Immigrants | Peru | 4.0 /100 | #225 | Tragic 63.1% |
| Immigrants | Colombia | 4.0 /100 | #226 | Tragic 63.1% |
| Immigrants | Ghana | 3.7 /100 | #227 | Tragic 63.1% |
| Samoans | 3.3 /100 | #228 | Tragic 63.0% |
| Liberians | 3.2 /100 | #229 | Tragic 63.0% |