Immigrants from Costa Rica vs Menominee Seniors Poverty Over the Age of 65
COMPARE
Immigrants from Costa Rica
Menominee
Seniors Poverty Over the Age of 65
Seniors Poverty Over the Age of 65 Comparison
Immigrants from Costa Rica
Menominee
11.8%
SENIORS POVERTY OVER THE AGE OF 65
2.7/ 100
METRIC RATING
228th/ 347
METRIC RANK
9.4%
SENIORS POVERTY OVER THE AGE OF 65
99.8/ 100
METRIC RATING
30th/ 347
METRIC RANK
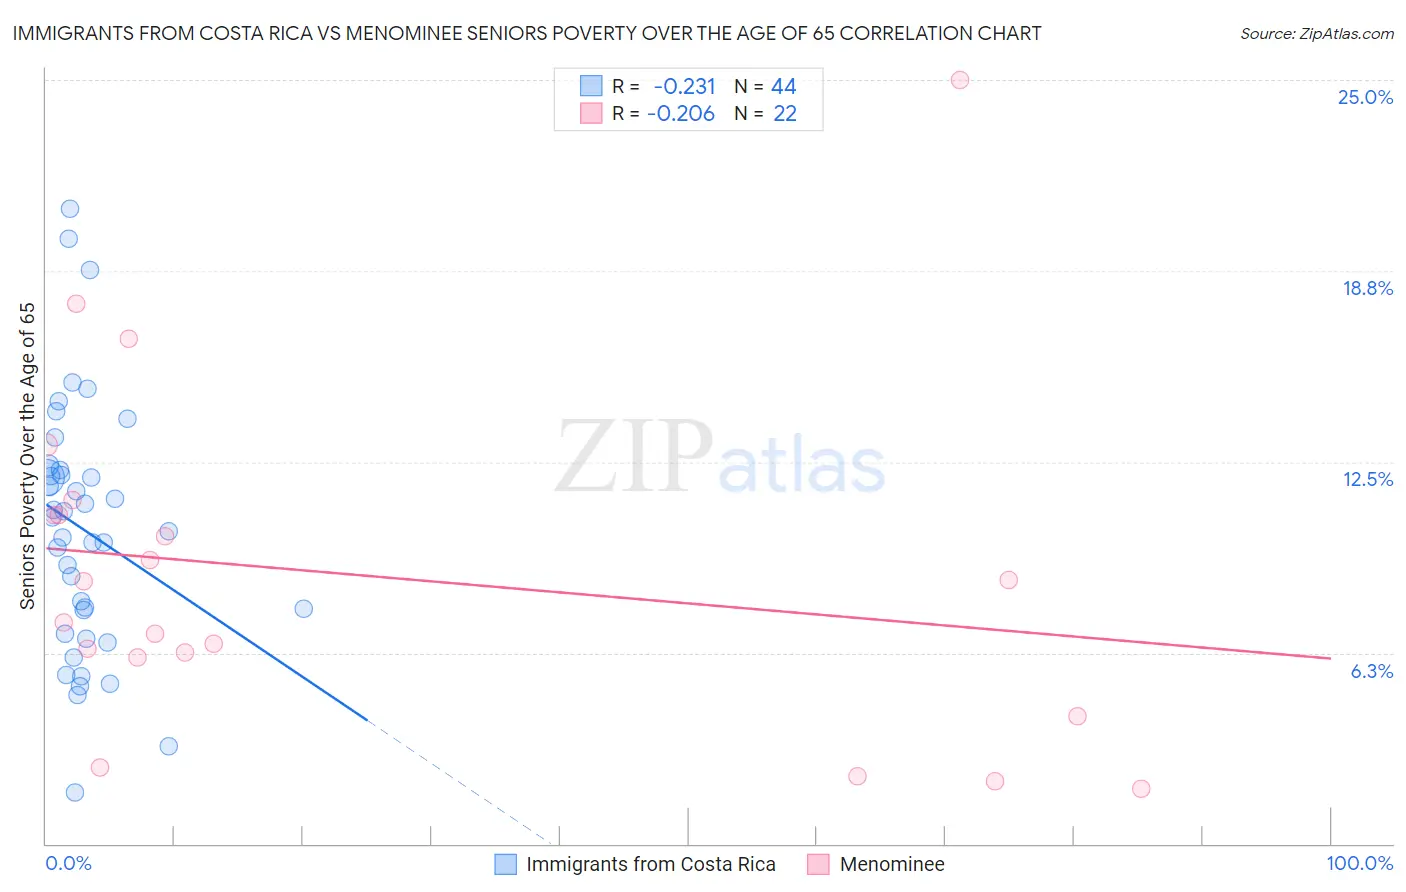
Immigrants from Costa Rica vs Menominee Seniors Poverty Over the Age of 65 Correlation Chart
The statistical analysis conducted on geographies consisting of 204,045,079 people shows a weak negative correlation between the proportion of Immigrants from Costa Rica and poverty level among seniors over the age of 65 in the United States with a correlation coefficient (R) of -0.231 and weighted average of 11.8%. Similarly, the statistical analysis conducted on geographies consisting of 45,758,945 people shows a weak negative correlation between the proportion of Menominee and poverty level among seniors over the age of 65 in the United States with a correlation coefficient (R) of -0.206 and weighted average of 9.4%, a difference of 26.1%.
Seniors Poverty Over the Age of 65 Correlation Summary
| Measurement | Immigrants from Costa Rica | Menominee |
| Minimum | 1.7% | 1.8% |
| Maximum | 20.8% | 25.0% |
| Range | 19.1% | 23.2% |
| Mean | 10.3% | 8.8% |
| Median | 10.5% | 7.9% |
| Interquartile 25% (IQ1) | 7.3% | 6.1% |
| Interquartile 75% (IQ3) | 12.1% | 10.7% |
| Interquartile Range (IQR) | 4.9% | 4.6% |
| Standard Deviation (Sample) | 4.1% | 5.6% |
| Standard Deviation (Population) | 4.1% | 5.5% |
Similar Demographics by Seniors Poverty Over the Age of 65
Demographics Similar to Immigrants from Costa Rica by Seniors Poverty Over the Age of 65
In terms of seniors poverty over the age of 65, the demographic groups most similar to Immigrants from Costa Rica are Immigrants from Eritrea (11.8%, a difference of 0.080%), Nigerian (11.8%, a difference of 0.33%), Liberian (11.8%, a difference of 0.36%), Immigrants from Belarus (11.8%, a difference of 0.38%), and Immigrants from Nigeria (11.7%, a difference of 0.48%).
| Demographics | Rating | Rank | Seniors Poverty Over the Age of 65 |
| Argentineans | 4.1 /100 | #221 | Tragic 11.7% |
| Immigrants | Chile | 3.9 /100 | #222 | Tragic 11.7% |
| Immigrants | Congo | 3.8 /100 | #223 | Tragic 11.7% |
| Immigrants | Nigeria | 3.4 /100 | #224 | Tragic 11.7% |
| Immigrants | Belarus | 3.2 /100 | #225 | Tragic 11.8% |
| Liberians | 3.2 /100 | #226 | Tragic 11.8% |
| Nigerians | 3.2 /100 | #227 | Tragic 11.8% |
| Immigrants | Costa Rica | 2.7 /100 | #228 | Tragic 11.8% |
| Immigrants | Eritrea | 2.6 /100 | #229 | Tragic 11.8% |
| Bermudans | 2.1 /100 | #230 | Tragic 11.9% |
| Cajuns | 2.0 /100 | #231 | Tragic 11.9% |
| Yaqui | 1.9 /100 | #232 | Tragic 11.9% |
| Panamanians | 1.8 /100 | #233 | Tragic 11.9% |
| Iroquois | 1.7 /100 | #234 | Tragic 11.9% |
| Immigrants | Argentina | 1.3 /100 | #235 | Tragic 12.0% |
Demographics Similar to Menominee by Seniors Poverty Over the Age of 65
In terms of seniors poverty over the age of 65, the demographic groups most similar to Menominee are Bhutanese (9.3%, a difference of 0.15%), Finnish (9.4%, a difference of 0.22%), Tongan (9.3%, a difference of 0.48%), Northern European (9.4%, a difference of 0.50%), and Native Hawaiian (9.4%, a difference of 0.52%).
| Demographics | Rating | Rank | Seniors Poverty Over the Age of 65 |
| Welsh | 99.9 /100 | #23 | Exceptional 9.3% |
| Bulgarians | 99.9 /100 | #24 | Exceptional 9.3% |
| Irish | 99.9 /100 | #25 | Exceptional 9.3% |
| Immigrants | Scotland | 99.9 /100 | #26 | Exceptional 9.3% |
| Italians | 99.9 /100 | #27 | Exceptional 9.3% |
| Tongans | 99.9 /100 | #28 | Exceptional 9.3% |
| Bhutanese | 99.9 /100 | #29 | Exceptional 9.3% |
| Menominee | 99.8 /100 | #30 | Exceptional 9.4% |
| Finns | 99.8 /100 | #31 | Exceptional 9.4% |
| Northern Europeans | 99.8 /100 | #32 | Exceptional 9.4% |
| Native Hawaiians | 99.8 /100 | #33 | Exceptional 9.4% |
| British | 99.8 /100 | #34 | Exceptional 9.4% |
| Latvians | 99.8 /100 | #35 | Exceptional 9.5% |
| Czechoslovakians | 99.8 /100 | #36 | Exceptional 9.5% |
| Scotch-Irish | 99.7 /100 | #37 | Exceptional 9.5% |