Immigrants from Costa Rica vs Menominee Householder Income Ages 25 - 44 years
COMPARE
Immigrants from Costa Rica
Menominee
Householder Income Ages 25 - 44 years
Householder Income Ages 25 - 44 years Comparison
Immigrants from Costa Rica
Menominee
$92,876
HOUSEHOLDER INCOME AGES 25 - 44 YEARS
28.2/ 100
METRIC RATING
192nd/ 347
METRIC RANK
$79,358
HOUSEHOLDER INCOME AGES 25 - 44 YEARS
0.0/ 100
METRIC RATING
313th/ 347
METRIC RANK
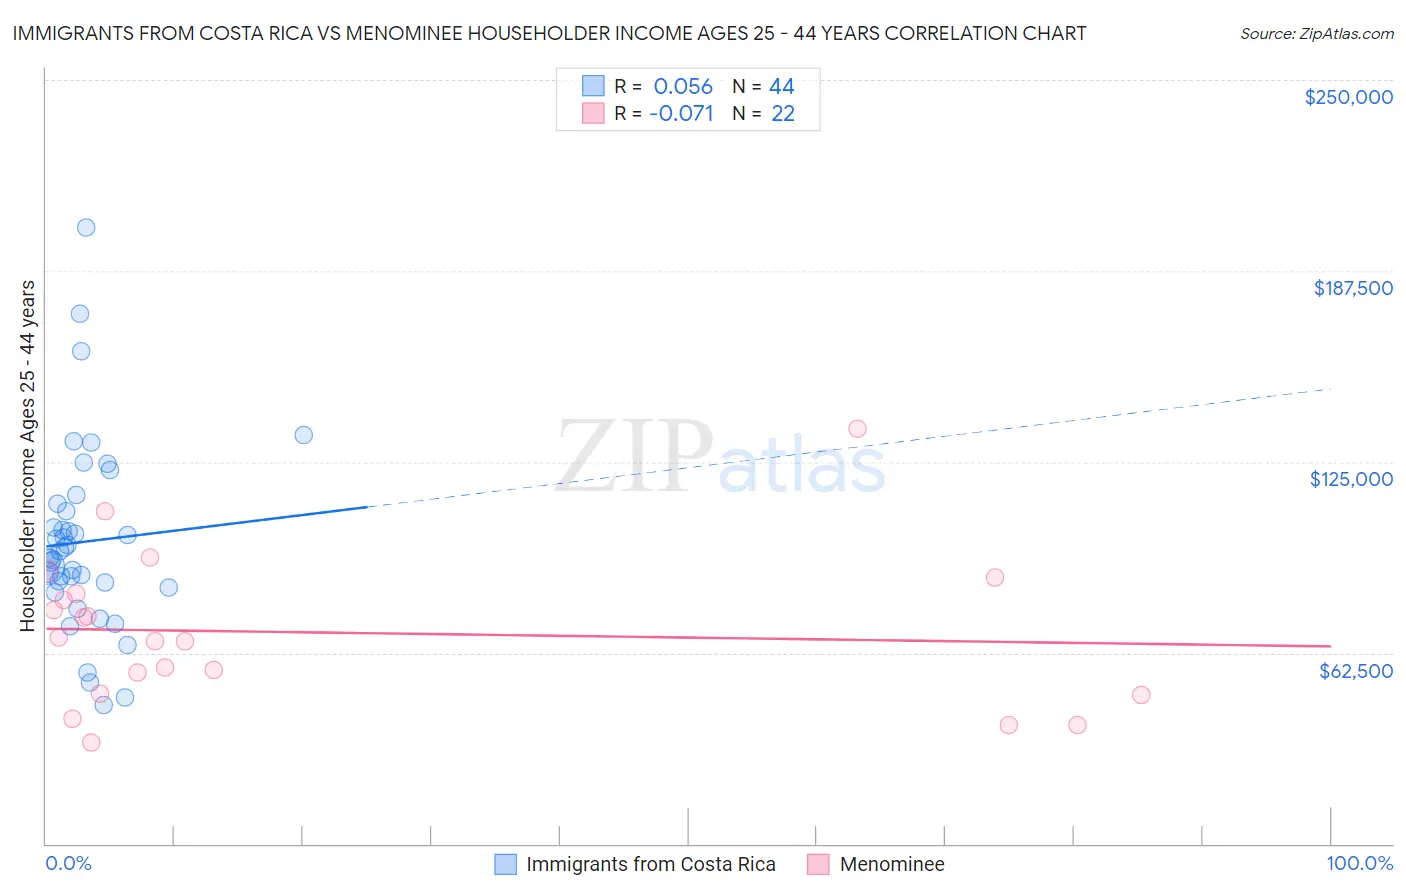
Immigrants from Costa Rica vs Menominee Householder Income Ages 25 - 44 years Correlation Chart
The statistical analysis conducted on geographies consisting of 204,048,993 people shows a slight positive correlation between the proportion of Immigrants from Costa Rica and household income with householder between the ages 25 and 44 in the United States with a correlation coefficient (R) of 0.056 and weighted average of $92,876. Similarly, the statistical analysis conducted on geographies consisting of 45,763,833 people shows a slight negative correlation between the proportion of Menominee and household income with householder between the ages 25 and 44 in the United States with a correlation coefficient (R) of -0.071 and weighted average of $79,358, a difference of 17.0%.
Householder Income Ages 25 - 44 years Correlation Summary
| Measurement | Immigrants from Costa Rica | Menominee |
| Minimum | $45,556 | $33,158 |
| Maximum | $201,608 | $135,924 |
| Range | $156,052 | $102,766 |
| Mean | $98,859 | $69,190 |
| Median | $94,496 | $66,974 |
| Interquartile 25% (IQ1) | $84,714 | $48,920 |
| Interquartile 75% (IQ3) | $110,006 | $81,800 |
| Interquartile Range (IQR) | $25,292 | $32,880 |
| Standard Deviation (Sample) | $30,715 | $24,876 |
| Standard Deviation (Population) | $30,364 | $24,304 |
Similar Demographics by Householder Income Ages 25 - 44 years
Demographics Similar to Immigrants from Costa Rica by Householder Income Ages 25 - 44 years
In terms of householder income ages 25 - 44 years, the demographic groups most similar to Immigrants from Costa Rica are Tlingit-Haida ($92,987, a difference of 0.12%), Welsh ($93,039, a difference of 0.18%), Dutch ($93,081, a difference of 0.22%), Immigrants from Sierra Leone ($93,115, a difference of 0.26%), and Spaniard ($93,366, a difference of 0.53%).
| Demographics | Rating | Rank | Householder Income Ages 25 - 44 years |
| Immigrants | Eritrea | 35.2 /100 | #185 | Fair $93,466 |
| Sierra Leoneans | 34.8 /100 | #186 | Fair $93,435 |
| Spaniards | 34.0 /100 | #187 | Fair $93,366 |
| Immigrants | Sierra Leone | 30.9 /100 | #188 | Fair $93,115 |
| Dutch | 30.5 /100 | #189 | Fair $93,081 |
| Welsh | 30.0 /100 | #190 | Fair $93,039 |
| Tlingit-Haida | 29.4 /100 | #191 | Fair $92,987 |
| Immigrants | Costa Rica | 28.2 /100 | #192 | Fair $92,876 |
| Samoans | 23.0 /100 | #193 | Fair $92,385 |
| Immigrants | Azores | 22.4 /100 | #194 | Fair $92,322 |
| Celtics | 21.6 /100 | #195 | Fair $92,241 |
| Immigrants | Colombia | 21.3 /100 | #196 | Fair $92,204 |
| Spanish | 21.2 /100 | #197 | Fair $92,200 |
| Vietnamese | 20.2 /100 | #198 | Fair $92,089 |
| Kenyans | 16.8 /100 | #199 | Poor $91,684 |
Demographics Similar to Menominee by Householder Income Ages 25 - 44 years
In terms of householder income ages 25 - 44 years, the demographic groups most similar to Menominee are Immigrants from Haiti ($79,391, a difference of 0.040%), Indonesian ($79,543, a difference of 0.23%), Cheyenne ($79,152, a difference of 0.26%), Ottawa ($79,012, a difference of 0.44%), and African ($78,986, a difference of 0.47%).
| Demographics | Rating | Rank | Householder Income Ages 25 - 44 years |
| Apache | 0.0 /100 | #306 | Tragic $80,260 |
| Haitians | 0.0 /100 | #307 | Tragic $80,055 |
| Immigrants | Central America | 0.0 /100 | #308 | Tragic $80,012 |
| Chippewa | 0.0 /100 | #309 | Tragic $80,005 |
| Fijians | 0.0 /100 | #310 | Tragic $79,956 |
| Indonesians | 0.0 /100 | #311 | Tragic $79,543 |
| Immigrants | Haiti | 0.0 /100 | #312 | Tragic $79,391 |
| Menominee | 0.0 /100 | #313 | Tragic $79,358 |
| Cheyenne | 0.0 /100 | #314 | Tragic $79,152 |
| Ottawa | 0.0 /100 | #315 | Tragic $79,012 |
| Africans | 0.0 /100 | #316 | Tragic $78,986 |
| U.S. Virgin Islanders | 0.0 /100 | #317 | Tragic $78,911 |
| Immigrants | Mexico | 0.0 /100 | #318 | Tragic $78,809 |
| Hondurans | 0.0 /100 | #319 | Tragic $78,540 |
| Choctaw | 0.0 /100 | #320 | Tragic $78,168 |