Immigrants from Chile vs Liberian College, 1 year or more
COMPARE
Immigrants from Chile
Liberian
College, 1 year or more
College, 1 year or more Comparison
Immigrants from Chile
Liberians
61.4%
COLLEGE, 1 YEAR OR MORE
92.3/ 100
METRIC RATING
122nd/ 347
METRIC RANK
56.7%
COLLEGE, 1 YEAR OR MORE
3.1/ 100
METRIC RATING
230th/ 347
METRIC RANK
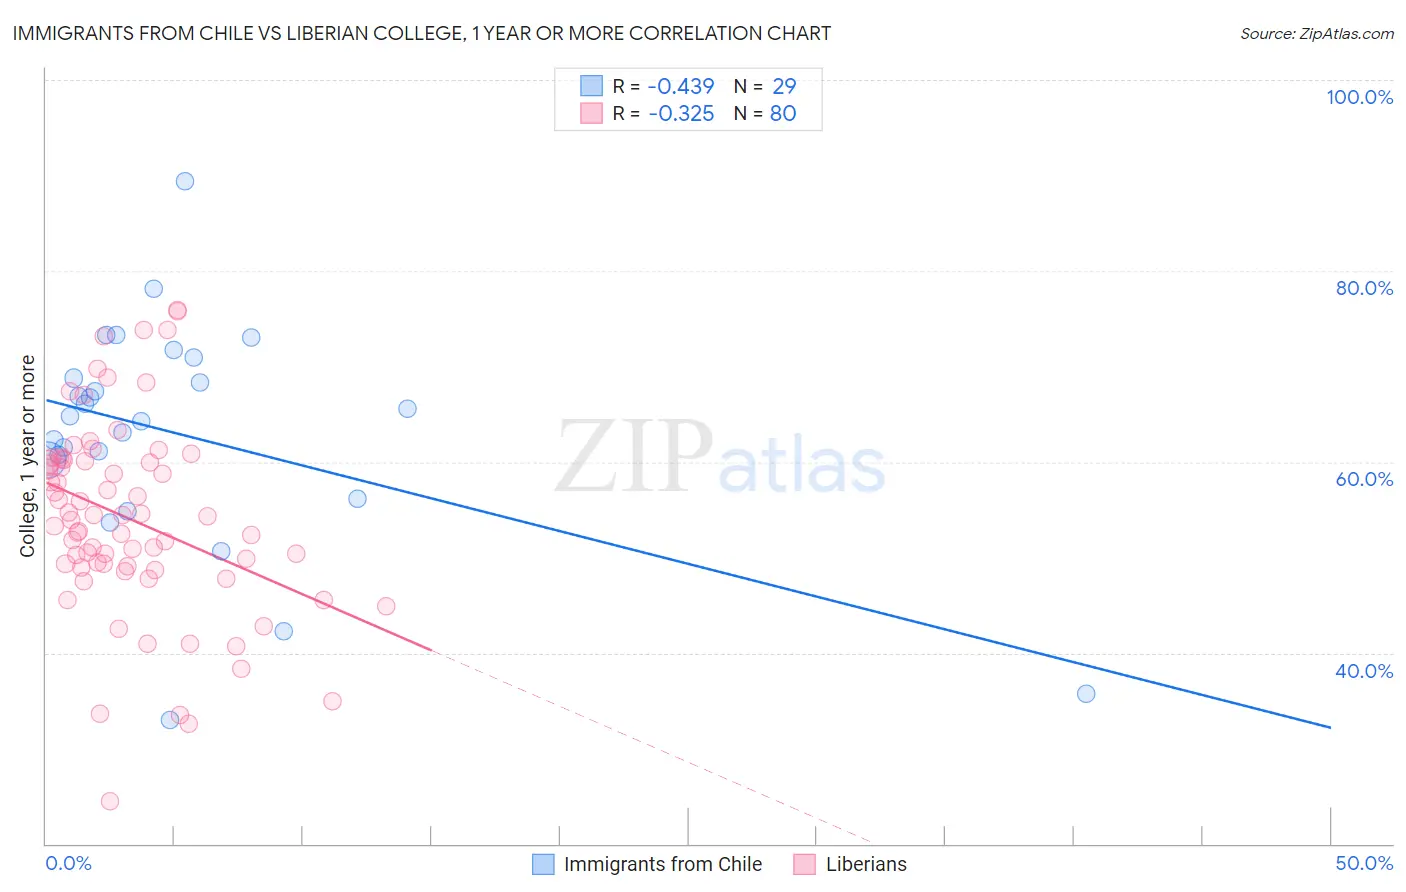
Immigrants from Chile vs Liberian College, 1 year or more Correlation Chart
The statistical analysis conducted on geographies consisting of 218,647,266 people shows a moderate negative correlation between the proportion of Immigrants from Chile and percentage of population with at least college, 1 year or more education in the United States with a correlation coefficient (R) of -0.439 and weighted average of 61.4%. Similarly, the statistical analysis conducted on geographies consisting of 118,103,458 people shows a mild negative correlation between the proportion of Liberians and percentage of population with at least college, 1 year or more education in the United States with a correlation coefficient (R) of -0.325 and weighted average of 56.7%, a difference of 8.2%.
College, 1 year or more Correlation Summary
| Measurement | Immigrants from Chile | Liberian |
| Minimum | 32.9% | 24.5% |
| Maximum | 89.4% | 75.9% |
| Range | 56.5% | 51.4% |
| Mean | 62.9% | 54.1% |
| Median | 64.7% | 54.1% |
| Interquartile 25% (IQ1) | 58.2% | 49.0% |
| Interquartile 75% (IQ3) | 69.8% | 60.1% |
| Interquartile Range (IQR) | 11.7% | 11.1% |
| Standard Deviation (Sample) | 11.9% | 10.2% |
| Standard Deviation (Population) | 11.7% | 10.1% |
Similar Demographics by College, 1 year or more
Demographics Similar to Immigrants from Chile by College, 1 year or more
In terms of college, 1 year or more, the demographic groups most similar to Immigrants from Chile are Serbian (61.4%, a difference of 0.010%), Venezuelan (61.3%, a difference of 0.040%), Immigrants from Jordan (61.4%, a difference of 0.080%), Immigrants from Syria (61.3%, a difference of 0.12%), and Alsatian (61.3%, a difference of 0.16%).
| Demographics | Rating | Rank | College, 1 year or more |
| Norwegians | 94.5 /100 | #115 | Exceptional 61.7% |
| Lebanese | 94.1 /100 | #116 | Exceptional 61.6% |
| Arabs | 93.9 /100 | #117 | Exceptional 61.6% |
| Immigrants | Brazil | 93.9 /100 | #118 | Exceptional 61.6% |
| Assyrians/Chaldeans/Syriacs | 93.3 /100 | #119 | Exceptional 61.5% |
| Pakistanis | 93.2 /100 | #120 | Exceptional 61.5% |
| Immigrants | Jordan | 92.7 /100 | #121 | Exceptional 61.4% |
| Immigrants | Chile | 92.3 /100 | #122 | Exceptional 61.4% |
| Serbians | 92.2 /100 | #123 | Exceptional 61.4% |
| Venezuelans | 92.1 /100 | #124 | Exceptional 61.3% |
| Immigrants | Syria | 91.6 /100 | #125 | Exceptional 61.3% |
| Alsatians | 91.3 /100 | #126 | Exceptional 61.3% |
| Immigrants | Eastern Africa | 91.1 /100 | #127 | Exceptional 61.2% |
| Immigrants | Italy | 91.1 /100 | #128 | Exceptional 61.2% |
| Ugandans | 90.7 /100 | #129 | Exceptional 61.2% |
Demographics Similar to Liberians by College, 1 year or more
In terms of college, 1 year or more, the demographic groups most similar to Liberians are Immigrants from Burma/Myanmar (56.6%, a difference of 0.19%), Cree (56.8%, a difference of 0.22%), Immigrants from Bangladesh (56.6%, a difference of 0.25%), Nonimmigrants (56.5%, a difference of 0.34%), and Immigrants from Fiji (56.9%, a difference of 0.35%).
| Demographics | Rating | Rank | College, 1 year or more |
| Portuguese | 5.4 /100 | #223 | Tragic 57.2% |
| Hmong | 5.4 /100 | #224 | Tragic 57.2% |
| Vietnamese | 4.7 /100 | #225 | Tragic 57.0% |
| Immigrants | Western Africa | 4.6 /100 | #226 | Tragic 57.0% |
| Immigrants | Immigrants | 4.4 /100 | #227 | Tragic 57.0% |
| Immigrants | Fiji | 4.0 /100 | #228 | Tragic 56.9% |
| Cree | 3.6 /100 | #229 | Tragic 56.8% |
| Liberians | 3.1 /100 | #230 | Tragic 56.7% |
| Immigrants | Burma/Myanmar | 2.7 /100 | #231 | Tragic 56.6% |
| Immigrants | Bangladesh | 2.6 /100 | #232 | Tragic 56.6% |
| Immigrants | Nonimmigrants | 2.5 /100 | #233 | Tragic 56.5% |
| Spanish Americans | 1.8 /100 | #234 | Tragic 56.3% |
| West Indians | 1.8 /100 | #235 | Tragic 56.3% |
| Iroquois | 1.7 /100 | #236 | Tragic 56.2% |
| Samoans | 1.6 /100 | #237 | Tragic 56.2% |