Immigrants from Chile vs Central American Indian College, 1 year or more
COMPARE
Immigrants from Chile
Central American Indian
College, 1 year or more
College, 1 year or more Comparison
Immigrants from Chile
Central American Indians
61.4%
COLLEGE, 1 YEAR OR MORE
92.3/ 100
METRIC RATING
122nd/ 347
METRIC RANK
53.5%
COLLEGE, 1 YEAR OR MORE
0.1/ 100
METRIC RATING
286th/ 347
METRIC RANK
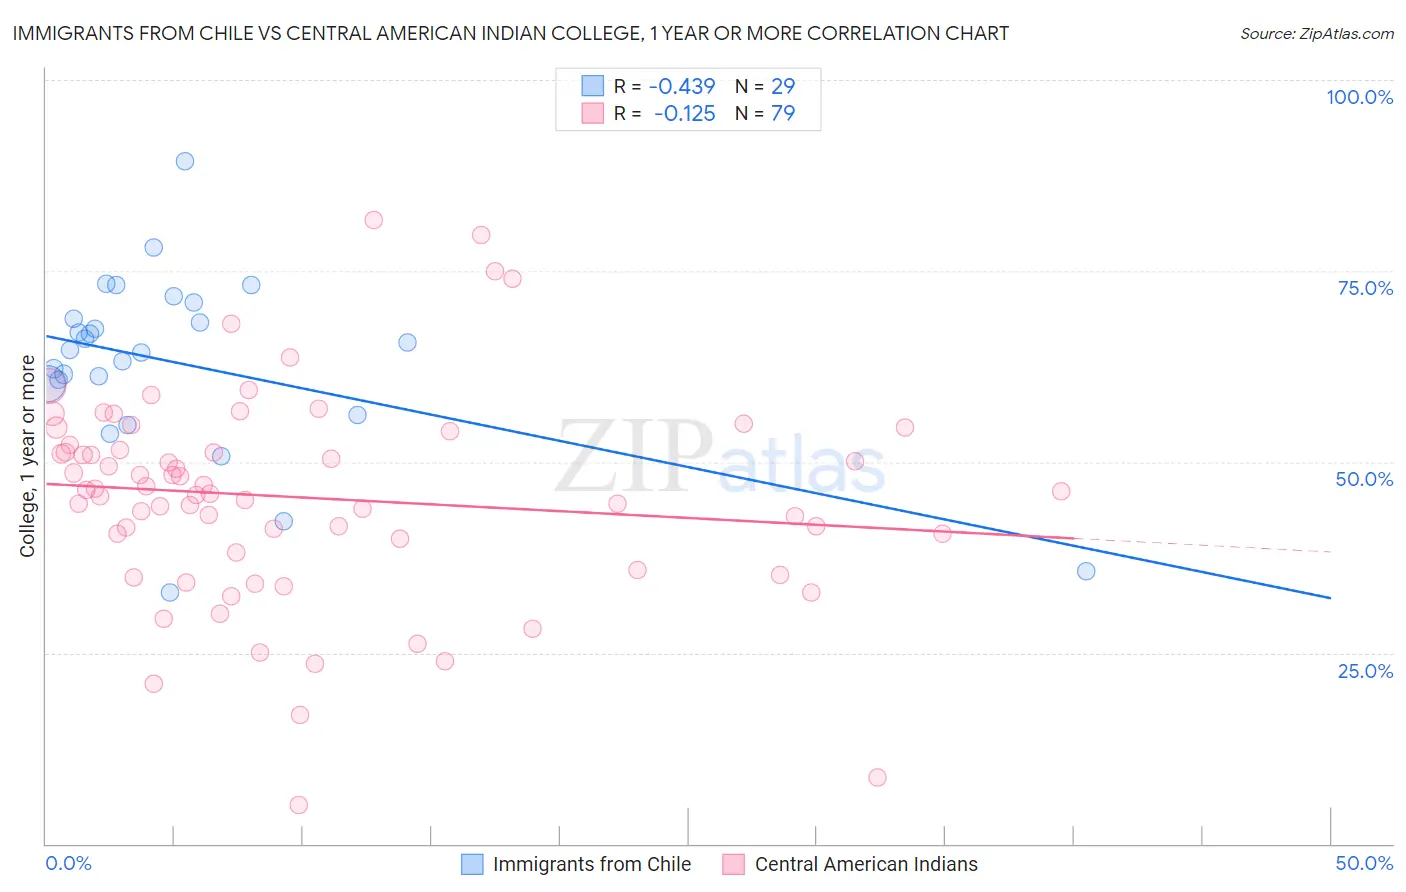
Immigrants from Chile vs Central American Indian College, 1 year or more Correlation Chart
The statistical analysis conducted on geographies consisting of 218,647,266 people shows a moderate negative correlation between the proportion of Immigrants from Chile and percentage of population with at least college, 1 year or more education in the United States with a correlation coefficient (R) of -0.439 and weighted average of 61.4%. Similarly, the statistical analysis conducted on geographies consisting of 326,142,624 people shows a poor negative correlation between the proportion of Central American Indians and percentage of population with at least college, 1 year or more education in the United States with a correlation coefficient (R) of -0.125 and weighted average of 53.5%, a difference of 14.6%.
College, 1 year or more Correlation Summary
| Measurement | Immigrants from Chile | Central American Indian |
| Minimum | 32.9% | 5.1% |
| Maximum | 89.4% | 81.6% |
| Range | 56.5% | 76.5% |
| Mean | 62.9% | 45.3% |
| Median | 64.7% | 46.2% |
| Interquartile 25% (IQ1) | 58.2% | 38.2% |
| Interquartile 75% (IQ3) | 69.8% | 52.2% |
| Interquartile Range (IQR) | 11.7% | 14.0% |
| Standard Deviation (Sample) | 11.9% | 13.9% |
| Standard Deviation (Population) | 11.7% | 13.9% |
Similar Demographics by College, 1 year or more
Demographics Similar to Immigrants from Chile by College, 1 year or more
In terms of college, 1 year or more, the demographic groups most similar to Immigrants from Chile are Serbian (61.4%, a difference of 0.010%), Venezuelan (61.3%, a difference of 0.040%), Immigrants from Jordan (61.4%, a difference of 0.080%), Immigrants from Syria (61.3%, a difference of 0.12%), and Alsatian (61.3%, a difference of 0.16%).
| Demographics | Rating | Rank | College, 1 year or more |
| Norwegians | 94.5 /100 | #115 | Exceptional 61.7% |
| Lebanese | 94.1 /100 | #116 | Exceptional 61.6% |
| Arabs | 93.9 /100 | #117 | Exceptional 61.6% |
| Immigrants | Brazil | 93.9 /100 | #118 | Exceptional 61.6% |
| Assyrians/Chaldeans/Syriacs | 93.3 /100 | #119 | Exceptional 61.5% |
| Pakistanis | 93.2 /100 | #120 | Exceptional 61.5% |
| Immigrants | Jordan | 92.7 /100 | #121 | Exceptional 61.4% |
| Immigrants | Chile | 92.3 /100 | #122 | Exceptional 61.4% |
| Serbians | 92.2 /100 | #123 | Exceptional 61.4% |
| Venezuelans | 92.1 /100 | #124 | Exceptional 61.3% |
| Immigrants | Syria | 91.6 /100 | #125 | Exceptional 61.3% |
| Alsatians | 91.3 /100 | #126 | Exceptional 61.3% |
| Immigrants | Eastern Africa | 91.1 /100 | #127 | Exceptional 61.2% |
| Immigrants | Italy | 91.1 /100 | #128 | Exceptional 61.2% |
| Ugandans | 90.7 /100 | #129 | Exceptional 61.2% |
Demographics Similar to Central American Indians by College, 1 year or more
In terms of college, 1 year or more, the demographic groups most similar to Central American Indians are Immigrants from Belize (53.5%, a difference of 0.030%), Immigrants from Guyana (53.5%, a difference of 0.040%), Alaska Native (53.4%, a difference of 0.20%), Immigrants from Ecuador (53.4%, a difference of 0.21%), and Alaskan Athabascan (53.4%, a difference of 0.22%).
| Demographics | Rating | Rank | College, 1 year or more |
| Arapaho | 0.1 /100 | #279 | Tragic 54.1% |
| Cheyenne | 0.1 /100 | #280 | Tragic 54.1% |
| Colville | 0.1 /100 | #281 | Tragic 54.1% |
| Guyanese | 0.1 /100 | #282 | Tragic 54.1% |
| Nicaraguans | 0.1 /100 | #283 | Tragic 53.9% |
| Ute | 0.1 /100 | #284 | Tragic 53.8% |
| Immigrants | Guyana | 0.1 /100 | #285 | Tragic 53.5% |
| Central American Indians | 0.1 /100 | #286 | Tragic 53.5% |
| Immigrants | Belize | 0.1 /100 | #287 | Tragic 53.5% |
| Alaska Natives | 0.0 /100 | #288 | Tragic 53.4% |
| Immigrants | Ecuador | 0.0 /100 | #289 | Tragic 53.4% |
| Alaskan Athabascans | 0.0 /100 | #290 | Tragic 53.4% |
| Cubans | 0.0 /100 | #291 | Tragic 53.4% |
| Chickasaw | 0.0 /100 | #292 | Tragic 53.3% |
| Blacks/African Americans | 0.0 /100 | #293 | Tragic 53.3% |