Immigrants from Chile vs Slavic College, 1 year or more
COMPARE
Immigrants from Chile
Slavic
College, 1 year or more
College, 1 year or more Comparison
Immigrants from Chile
Slavs
61.4%
COLLEGE, 1 YEAR OR MORE
92.3/ 100
METRIC RATING
122nd/ 347
METRIC RANK
60.6%
COLLEGE, 1 YEAR OR MORE
81.1/ 100
METRIC RATING
145th/ 347
METRIC RANK
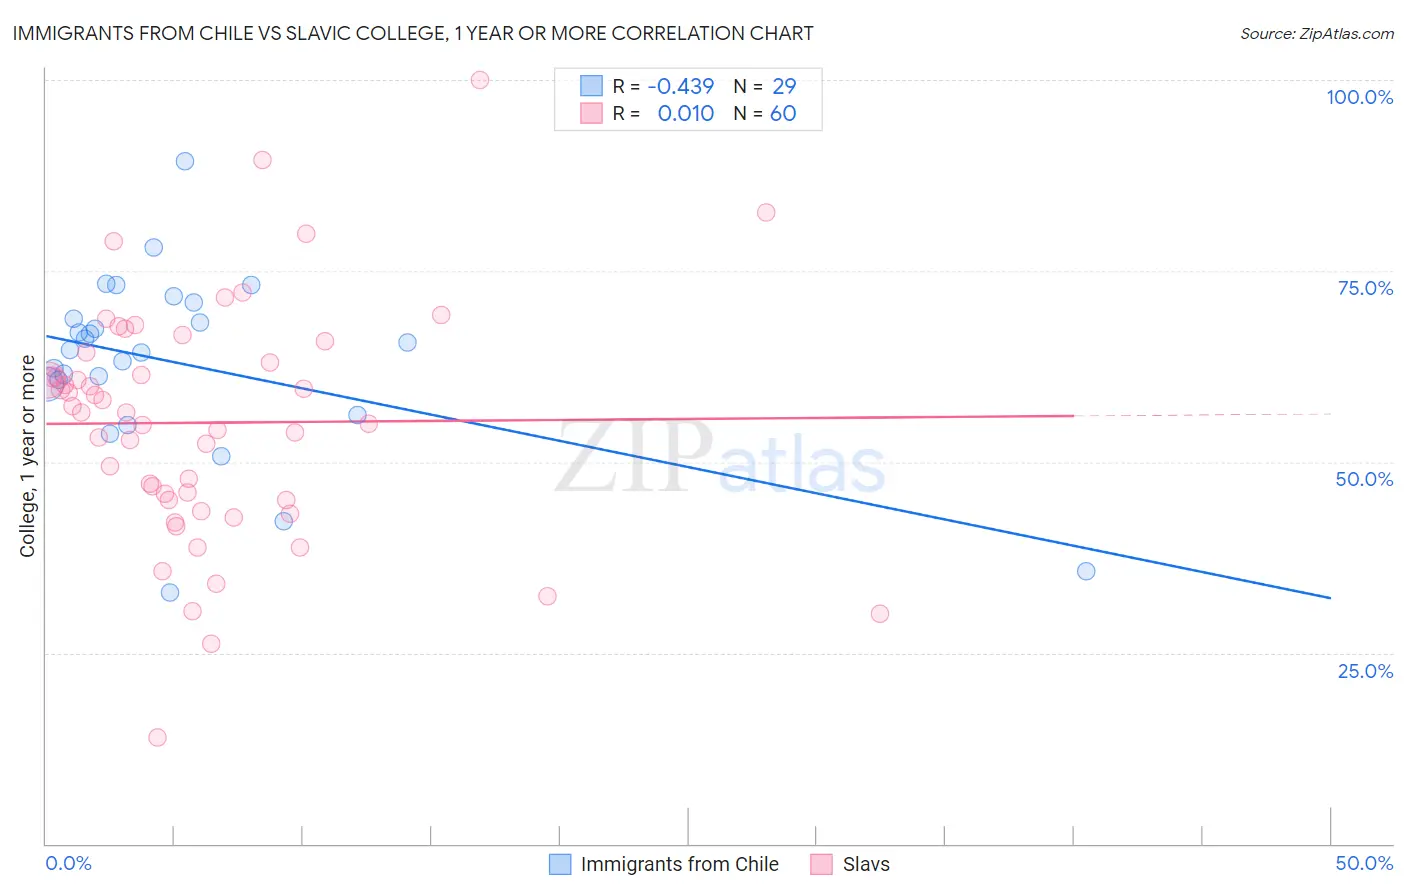
Immigrants from Chile vs Slavic College, 1 year or more Correlation Chart
The statistical analysis conducted on geographies consisting of 218,647,266 people shows a moderate negative correlation between the proportion of Immigrants from Chile and percentage of population with at least college, 1 year or more education in the United States with a correlation coefficient (R) of -0.439 and weighted average of 61.4%. Similarly, the statistical analysis conducted on geographies consisting of 270,867,316 people shows no correlation between the proportion of Slavs and percentage of population with at least college, 1 year or more education in the United States with a correlation coefficient (R) of 0.010 and weighted average of 60.6%, a difference of 1.3%.
College, 1 year or more Correlation Summary
| Measurement | Immigrants from Chile | Slavic |
| Minimum | 32.9% | 14.0% |
| Maximum | 89.4% | 100.0% |
| Range | 56.5% | 86.0% |
| Mean | 62.9% | 55.1% |
| Median | 64.7% | 56.5% |
| Interquartile 25% (IQ1) | 58.2% | 45.0% |
| Interquartile 75% (IQ3) | 69.8% | 63.6% |
| Interquartile Range (IQR) | 11.7% | 18.6% |
| Standard Deviation (Sample) | 11.9% | 15.6% |
| Standard Deviation (Population) | 11.7% | 15.4% |
Similar Demographics by College, 1 year or more
Demographics Similar to Immigrants from Chile by College, 1 year or more
In terms of college, 1 year or more, the demographic groups most similar to Immigrants from Chile are Serbian (61.4%, a difference of 0.010%), Venezuelan (61.3%, a difference of 0.040%), Immigrants from Jordan (61.4%, a difference of 0.080%), Immigrants from Syria (61.3%, a difference of 0.12%), and Alsatian (61.3%, a difference of 0.16%).
| Demographics | Rating | Rank | College, 1 year or more |
| Norwegians | 94.5 /100 | #115 | Exceptional 61.7% |
| Lebanese | 94.1 /100 | #116 | Exceptional 61.6% |
| Arabs | 93.9 /100 | #117 | Exceptional 61.6% |
| Immigrants | Brazil | 93.9 /100 | #118 | Exceptional 61.6% |
| Assyrians/Chaldeans/Syriacs | 93.3 /100 | #119 | Exceptional 61.5% |
| Pakistanis | 93.2 /100 | #120 | Exceptional 61.5% |
| Immigrants | Jordan | 92.7 /100 | #121 | Exceptional 61.4% |
| Immigrants | Chile | 92.3 /100 | #122 | Exceptional 61.4% |
| Serbians | 92.2 /100 | #123 | Exceptional 61.4% |
| Venezuelans | 92.1 /100 | #124 | Exceptional 61.3% |
| Immigrants | Syria | 91.6 /100 | #125 | Exceptional 61.3% |
| Alsatians | 91.3 /100 | #126 | Exceptional 61.3% |
| Immigrants | Eastern Africa | 91.1 /100 | #127 | Exceptional 61.2% |
| Immigrants | Italy | 91.1 /100 | #128 | Exceptional 61.2% |
| Ugandans | 90.7 /100 | #129 | Exceptional 61.2% |
Demographics Similar to Slavs by College, 1 year or more
In terms of college, 1 year or more, the demographic groups most similar to Slavs are Czech (60.6%, a difference of 0.070%), Scottish (60.5%, a difference of 0.070%), Canadian (60.6%, a difference of 0.14%), Polish (60.7%, a difference of 0.15%), and Immigrants from Kenya (60.5%, a difference of 0.16%).
| Demographics | Rating | Rank | College, 1 year or more |
| Taiwanese | 84.3 /100 | #138 | Excellent 60.7% |
| Immigrants | Eritrea | 84.3 /100 | #139 | Excellent 60.7% |
| Iraqis | 83.3 /100 | #140 | Excellent 60.7% |
| Immigrants | Afghanistan | 83.1 /100 | #141 | Excellent 60.7% |
| Poles | 82.8 /100 | #142 | Excellent 60.7% |
| Canadians | 82.7 /100 | #143 | Excellent 60.6% |
| Czechs | 81.9 /100 | #144 | Excellent 60.6% |
| Slavs | 81.1 /100 | #145 | Excellent 60.6% |
| Scottish | 80.2 /100 | #146 | Excellent 60.5% |
| Immigrants | Kenya | 79.1 /100 | #147 | Good 60.5% |
| Kenyans | 79.0 /100 | #148 | Good 60.5% |
| Brazilians | 79.0 /100 | #149 | Good 60.5% |
| Immigrants | Sudan | 77.8 /100 | #150 | Good 60.4% |
| Albanians | 77.8 /100 | #151 | Good 60.4% |
| Immigrants | Germany | 76.1 /100 | #152 | Good 60.3% |