Immigrants from Chile vs Immigrants from South Eastern Asia College, 1 year or more
COMPARE
Immigrants from Chile
Immigrants from South Eastern Asia
College, 1 year or more
College, 1 year or more Comparison
Immigrants from Chile
Immigrants from South Eastern Asia
61.4%
COLLEGE, 1 YEAR OR MORE
92.3/ 100
METRIC RATING
122nd/ 347
METRIC RANK
58.5%
COLLEGE, 1 YEAR OR MORE
25.1/ 100
METRIC RATING
198th/ 347
METRIC RANK
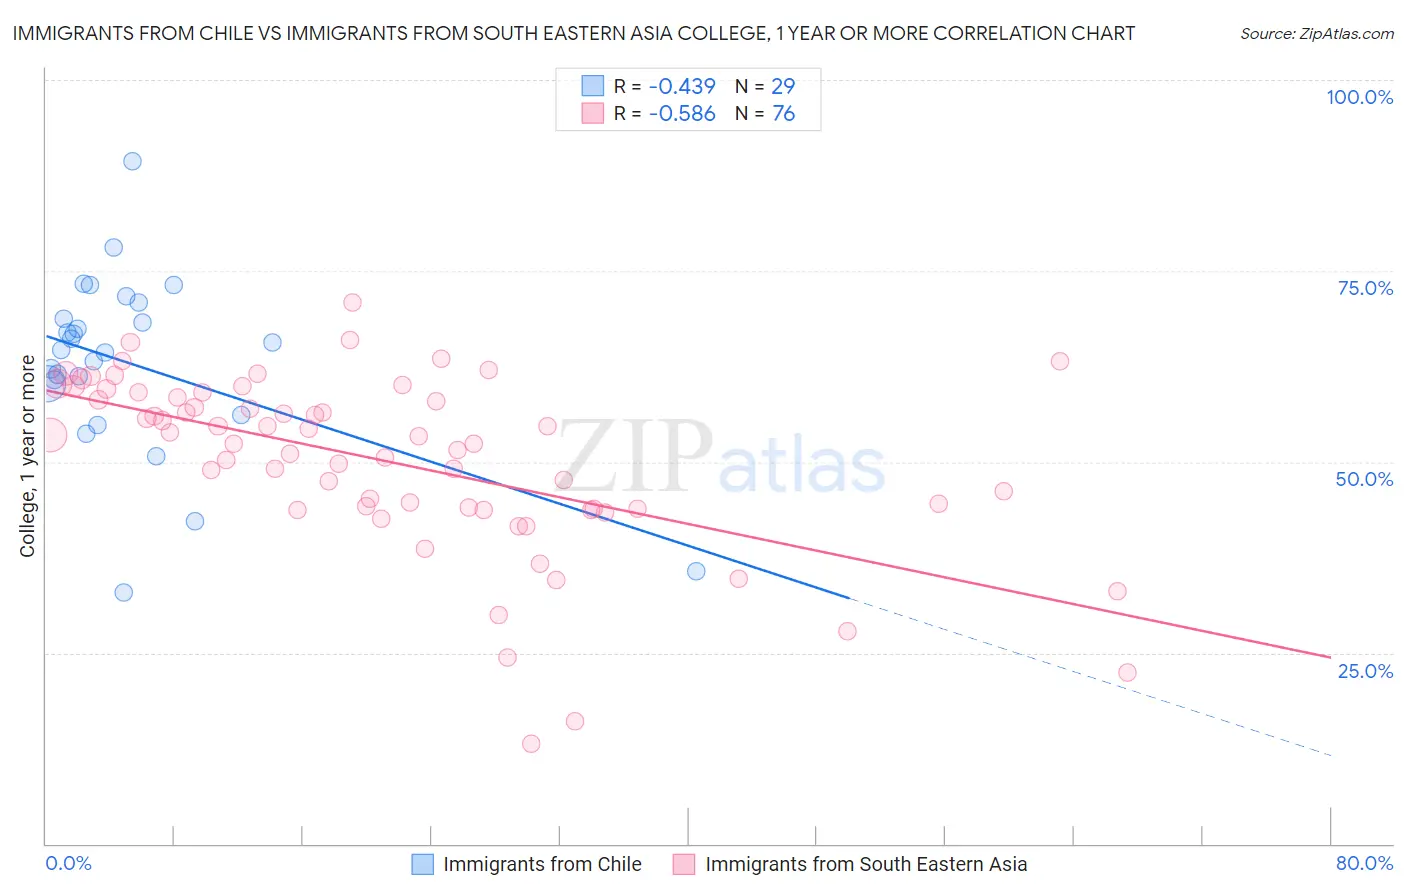
Immigrants from Chile vs Immigrants from South Eastern Asia College, 1 year or more Correlation Chart
The statistical analysis conducted on geographies consisting of 218,647,266 people shows a moderate negative correlation between the proportion of Immigrants from Chile and percentage of population with at least college, 1 year or more education in the United States with a correlation coefficient (R) of -0.439 and weighted average of 61.4%. Similarly, the statistical analysis conducted on geographies consisting of 512,706,379 people shows a substantial negative correlation between the proportion of Immigrants from South Eastern Asia and percentage of population with at least college, 1 year or more education in the United States with a correlation coefficient (R) of -0.586 and weighted average of 58.5%, a difference of 4.8%.
College, 1 year or more Correlation Summary
| Measurement | Immigrants from Chile | Immigrants from South Eastern Asia |
| Minimum | 32.9% | 13.0% |
| Maximum | 89.4% | 70.8% |
| Range | 56.5% | 57.8% |
| Mean | 62.9% | 50.1% |
| Median | 64.7% | 52.9% |
| Interquartile 25% (IQ1) | 58.2% | 43.8% |
| Interquartile 75% (IQ3) | 69.8% | 58.7% |
| Interquartile Range (IQR) | 11.7% | 14.9% |
| Standard Deviation (Sample) | 11.9% | 11.6% |
| Standard Deviation (Population) | 11.7% | 11.5% |
Similar Demographics by College, 1 year or more
Demographics Similar to Immigrants from Chile by College, 1 year or more
In terms of college, 1 year or more, the demographic groups most similar to Immigrants from Chile are Serbian (61.4%, a difference of 0.010%), Venezuelan (61.3%, a difference of 0.040%), Immigrants from Jordan (61.4%, a difference of 0.080%), Immigrants from Syria (61.3%, a difference of 0.12%), and Alsatian (61.3%, a difference of 0.16%).
| Demographics | Rating | Rank | College, 1 year or more |
| Norwegians | 94.5 /100 | #115 | Exceptional 61.7% |
| Lebanese | 94.1 /100 | #116 | Exceptional 61.6% |
| Arabs | 93.9 /100 | #117 | Exceptional 61.6% |
| Immigrants | Brazil | 93.9 /100 | #118 | Exceptional 61.6% |
| Assyrians/Chaldeans/Syriacs | 93.3 /100 | #119 | Exceptional 61.5% |
| Pakistanis | 93.2 /100 | #120 | Exceptional 61.5% |
| Immigrants | Jordan | 92.7 /100 | #121 | Exceptional 61.4% |
| Immigrants | Chile | 92.3 /100 | #122 | Exceptional 61.4% |
| Serbians | 92.2 /100 | #123 | Exceptional 61.4% |
| Venezuelans | 92.1 /100 | #124 | Exceptional 61.3% |
| Immigrants | Syria | 91.6 /100 | #125 | Exceptional 61.3% |
| Alsatians | 91.3 /100 | #126 | Exceptional 61.3% |
| Immigrants | Eastern Africa | 91.1 /100 | #127 | Exceptional 61.2% |
| Immigrants | Italy | 91.1 /100 | #128 | Exceptional 61.2% |
| Ugandans | 90.7 /100 | #129 | Exceptional 61.2% |
Demographics Similar to Immigrants from South Eastern Asia by College, 1 year or more
In terms of college, 1 year or more, the demographic groups most similar to Immigrants from South Eastern Asia are Slovak (58.5%, a difference of 0.040%), Immigrants from Thailand (58.6%, a difference of 0.070%), Spanish (58.5%, a difference of 0.070%), Dutch (58.6%, a difference of 0.080%), and Guamanian/Chamorro (58.6%, a difference of 0.080%).
| Demographics | Rating | Rank | College, 1 year or more |
| Immigrants | Philippines | 29.2 /100 | #191 | Fair 58.7% |
| Colombians | 27.6 /100 | #192 | Fair 58.7% |
| Peruvians | 27.5 /100 | #193 | Fair 58.6% |
| Costa Ricans | 26.4 /100 | #194 | Fair 58.6% |
| Dutch | 26.2 /100 | #195 | Fair 58.6% |
| Guamanians/Chamorros | 26.2 /100 | #196 | Fair 58.6% |
| Immigrants | Thailand | 26.0 /100 | #197 | Fair 58.6% |
| Immigrants | South Eastern Asia | 25.1 /100 | #198 | Fair 58.5% |
| Slovaks | 24.6 /100 | #199 | Fair 58.5% |
| Spanish | 24.2 /100 | #200 | Fair 58.5% |
| Nigerians | 23.0 /100 | #201 | Fair 58.5% |
| Immigrants | South America | 21.9 /100 | #202 | Fair 58.4% |
| Ghanaians | 20.9 /100 | #203 | Fair 58.4% |
| Panamanians | 19.2 /100 | #204 | Poor 58.3% |
| Immigrants | Zaire | 18.7 /100 | #205 | Poor 58.3% |