Immigrants from Chile vs Immigrants from Trinidad and Tobago College, 1 year or more
COMPARE
Immigrants from Chile
Immigrants from Trinidad and Tobago
College, 1 year or more
College, 1 year or more Comparison
Immigrants from Chile
Immigrants from Trinidad and Tobago
61.4%
COLLEGE, 1 YEAR OR MORE
92.3/ 100
METRIC RATING
122nd/ 347
METRIC RANK
55.5%
COLLEGE, 1 YEAR OR MORE
0.7/ 100
METRIC RATING
249th/ 347
METRIC RANK
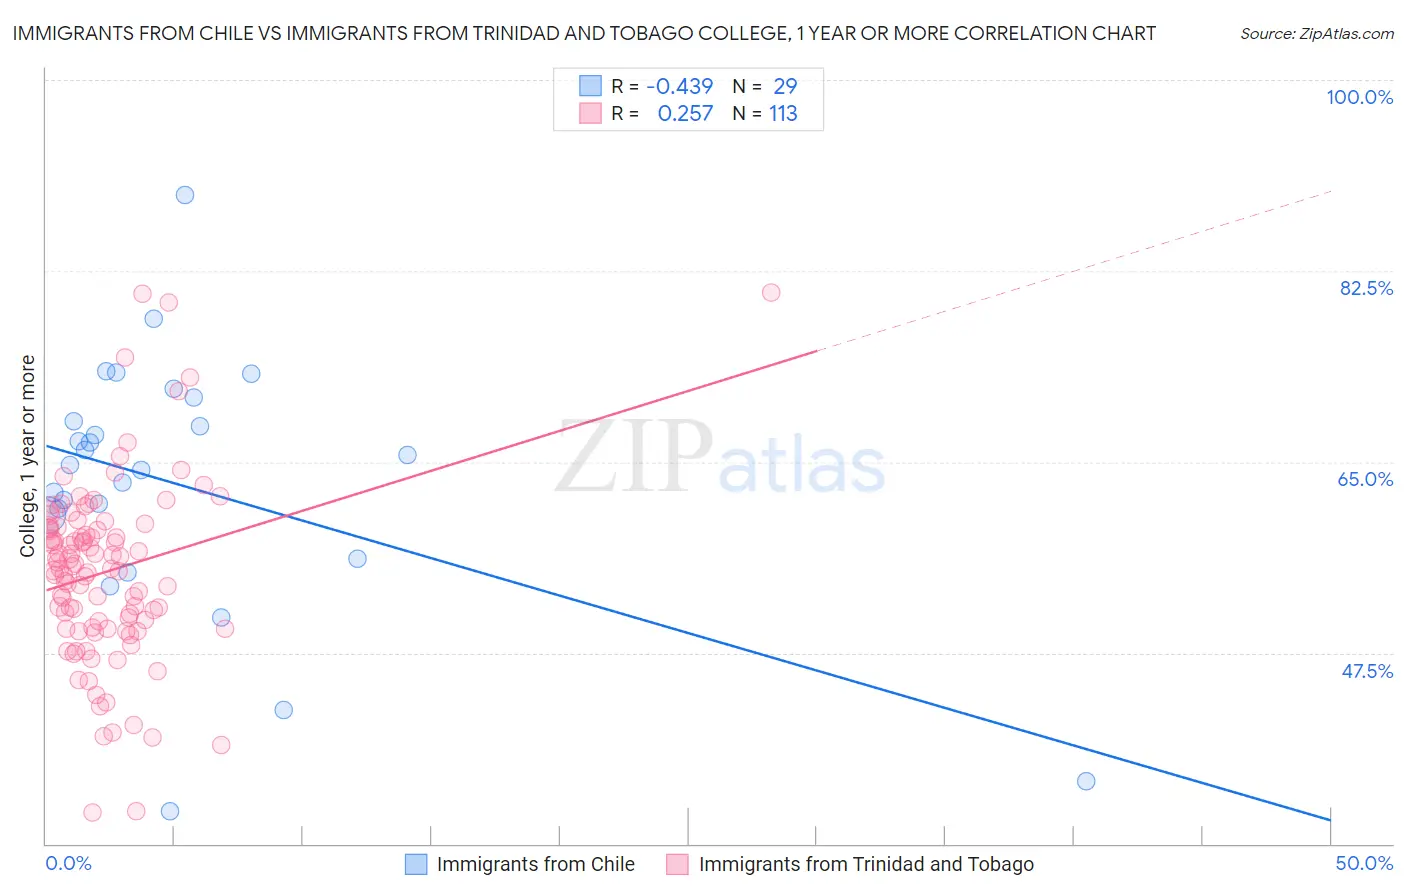
Immigrants from Chile vs Immigrants from Trinidad and Tobago College, 1 year or more Correlation Chart
The statistical analysis conducted on geographies consisting of 218,647,266 people shows a moderate negative correlation between the proportion of Immigrants from Chile and percentage of population with at least college, 1 year or more education in the United States with a correlation coefficient (R) of -0.439 and weighted average of 61.4%. Similarly, the statistical analysis conducted on geographies consisting of 223,526,872 people shows a weak positive correlation between the proportion of Immigrants from Trinidad and Tobago and percentage of population with at least college, 1 year or more education in the United States with a correlation coefficient (R) of 0.257 and weighted average of 55.5%, a difference of 10.5%.
College, 1 year or more Correlation Summary
| Measurement | Immigrants from Chile | Immigrants from Trinidad and Tobago |
| Minimum | 32.9% | 32.9% |
| Maximum | 89.4% | 80.5% |
| Range | 56.5% | 47.6% |
| Mean | 62.9% | 54.9% |
| Median | 64.7% | 55.2% |
| Interquartile 25% (IQ1) | 58.2% | 49.8% |
| Interquartile 75% (IQ3) | 69.8% | 58.9% |
| Interquartile Range (IQR) | 11.7% | 9.1% |
| Standard Deviation (Sample) | 11.9% | 8.3% |
| Standard Deviation (Population) | 11.7% | 8.3% |
Similar Demographics by College, 1 year or more
Demographics Similar to Immigrants from Chile by College, 1 year or more
In terms of college, 1 year or more, the demographic groups most similar to Immigrants from Chile are Serbian (61.4%, a difference of 0.010%), Venezuelan (61.3%, a difference of 0.040%), Immigrants from Jordan (61.4%, a difference of 0.080%), Immigrants from Syria (61.3%, a difference of 0.12%), and Alsatian (61.3%, a difference of 0.16%).
| Demographics | Rating | Rank | College, 1 year or more |
| Norwegians | 94.5 /100 | #115 | Exceptional 61.7% |
| Lebanese | 94.1 /100 | #116 | Exceptional 61.6% |
| Arabs | 93.9 /100 | #117 | Exceptional 61.6% |
| Immigrants | Brazil | 93.9 /100 | #118 | Exceptional 61.6% |
| Assyrians/Chaldeans/Syriacs | 93.3 /100 | #119 | Exceptional 61.5% |
| Pakistanis | 93.2 /100 | #120 | Exceptional 61.5% |
| Immigrants | Jordan | 92.7 /100 | #121 | Exceptional 61.4% |
| Immigrants | Chile | 92.3 /100 | #122 | Exceptional 61.4% |
| Serbians | 92.2 /100 | #123 | Exceptional 61.4% |
| Venezuelans | 92.1 /100 | #124 | Exceptional 61.3% |
| Immigrants | Syria | 91.6 /100 | #125 | Exceptional 61.3% |
| Alsatians | 91.3 /100 | #126 | Exceptional 61.3% |
| Immigrants | Eastern Africa | 91.1 /100 | #127 | Exceptional 61.2% |
| Immigrants | Italy | 91.1 /100 | #128 | Exceptional 61.2% |
| Ugandans | 90.7 /100 | #129 | Exceptional 61.2% |
Demographics Similar to Immigrants from Trinidad and Tobago by College, 1 year or more
In terms of college, 1 year or more, the demographic groups most similar to Immigrants from Trinidad and Tobago are Delaware (55.5%, a difference of 0.020%), Immigrants from Congo (55.6%, a difference of 0.10%), Immigrants from Cambodia (55.4%, a difference of 0.11%), Hawaiian (55.6%, a difference of 0.13%), and Aleut (55.4%, a difference of 0.14%).
| Demographics | Rating | Rank | College, 1 year or more |
| Marshallese | 1.0 /100 | #242 | Tragic 55.8% |
| Osage | 1.0 /100 | #243 | Tragic 55.8% |
| Chippewa | 0.9 /100 | #244 | Tragic 55.7% |
| Immigrants | Liberia | 0.8 /100 | #245 | Tragic 55.7% |
| Malaysians | 0.8 /100 | #246 | Tragic 55.6% |
| Hawaiians | 0.8 /100 | #247 | Tragic 55.6% |
| Immigrants | Congo | 0.8 /100 | #248 | Tragic 55.6% |
| Immigrants | Trinidad and Tobago | 0.7 /100 | #249 | Tragic 55.5% |
| Delaware | 0.7 /100 | #250 | Tragic 55.5% |
| Immigrants | Cambodia | 0.6 /100 | #251 | Tragic 55.4% |
| Aleuts | 0.6 /100 | #252 | Tragic 55.4% |
| Immigrants | Barbados | 0.6 /100 | #253 | Tragic 55.4% |
| Japanese | 0.5 /100 | #254 | Tragic 55.2% |
| Immigrants | Bahamas | 0.5 /100 | #255 | Tragic 55.2% |
| Immigrants | West Indies | 0.5 /100 | #256 | Tragic 55.2% |