Immigrants from Chile vs Choctaw College, 1 year or more
COMPARE
Immigrants from Chile
Choctaw
College, 1 year or more
College, 1 year or more Comparison
Immigrants from Chile
Choctaw
61.4%
COLLEGE, 1 YEAR OR MORE
92.3/ 100
METRIC RATING
122nd/ 347
METRIC RANK
52.3%
COLLEGE, 1 YEAR OR MORE
0.0/ 100
METRIC RATING
300th/ 347
METRIC RANK
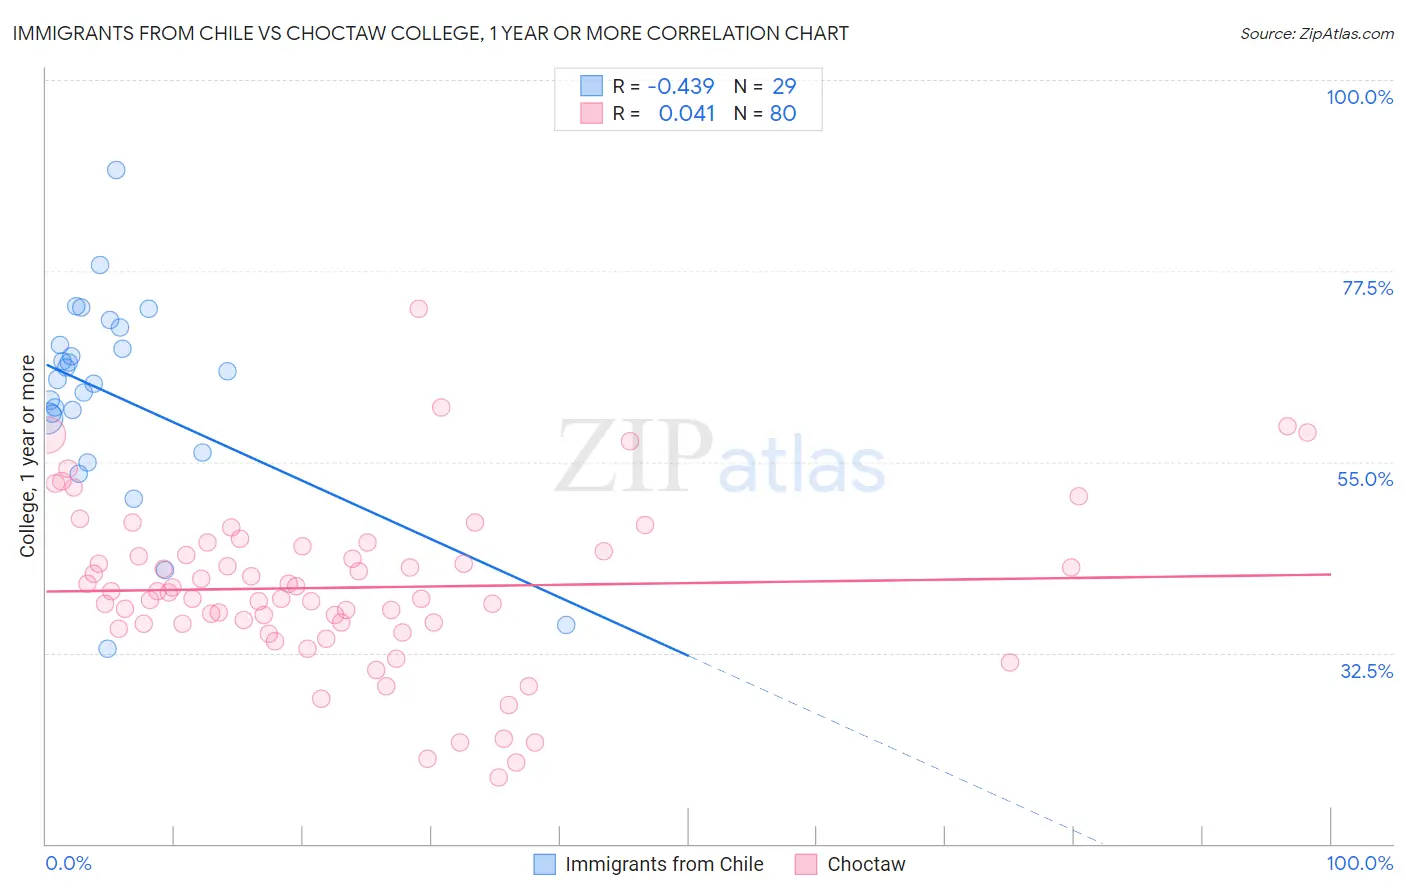
Immigrants from Chile vs Choctaw College, 1 year or more Correlation Chart
The statistical analysis conducted on geographies consisting of 218,647,266 people shows a moderate negative correlation between the proportion of Immigrants from Chile and percentage of population with at least college, 1 year or more education in the United States with a correlation coefficient (R) of -0.439 and weighted average of 61.4%. Similarly, the statistical analysis conducted on geographies consisting of 269,741,564 people shows no correlation between the proportion of Choctaw and percentage of population with at least college, 1 year or more education in the United States with a correlation coefficient (R) of 0.041 and weighted average of 52.3%, a difference of 17.2%.
College, 1 year or more Correlation Summary
| Measurement | Immigrants from Chile | Choctaw |
| Minimum | 32.9% | 17.8% |
| Maximum | 89.4% | 73.1% |
| Range | 56.5% | 55.3% |
| Mean | 62.9% | 40.2% |
| Median | 64.7% | 39.7% |
| Interquartile 25% (IQ1) | 58.2% | 35.9% |
| Interquartile 75% (IQ3) | 69.8% | 44.7% |
| Interquartile Range (IQR) | 11.7% | 8.8% |
| Standard Deviation (Sample) | 11.9% | 9.9% |
| Standard Deviation (Population) | 11.7% | 9.8% |
Similar Demographics by College, 1 year or more
Demographics Similar to Immigrants from Chile by College, 1 year or more
In terms of college, 1 year or more, the demographic groups most similar to Immigrants from Chile are Serbian (61.4%, a difference of 0.010%), Venezuelan (61.3%, a difference of 0.040%), Immigrants from Jordan (61.4%, a difference of 0.080%), Immigrants from Syria (61.3%, a difference of 0.12%), and Alsatian (61.3%, a difference of 0.16%).
| Demographics | Rating | Rank | College, 1 year or more |
| Norwegians | 94.5 /100 | #115 | Exceptional 61.7% |
| Lebanese | 94.1 /100 | #116 | Exceptional 61.6% |
| Arabs | 93.9 /100 | #117 | Exceptional 61.6% |
| Immigrants | Brazil | 93.9 /100 | #118 | Exceptional 61.6% |
| Assyrians/Chaldeans/Syriacs | 93.3 /100 | #119 | Exceptional 61.5% |
| Pakistanis | 93.2 /100 | #120 | Exceptional 61.5% |
| Immigrants | Jordan | 92.7 /100 | #121 | Exceptional 61.4% |
| Immigrants | Chile | 92.3 /100 | #122 | Exceptional 61.4% |
| Serbians | 92.2 /100 | #123 | Exceptional 61.4% |
| Venezuelans | 92.1 /100 | #124 | Exceptional 61.3% |
| Immigrants | Syria | 91.6 /100 | #125 | Exceptional 61.3% |
| Alsatians | 91.3 /100 | #126 | Exceptional 61.3% |
| Immigrants | Eastern Africa | 91.1 /100 | #127 | Exceptional 61.2% |
| Immigrants | Italy | 91.1 /100 | #128 | Exceptional 61.2% |
| Ugandans | 90.7 /100 | #129 | Exceptional 61.2% |
Demographics Similar to Choctaw by College, 1 year or more
In terms of college, 1 year or more, the demographic groups most similar to Choctaw are Immigrants from Nicaragua (52.4%, a difference of 0.040%), Haitian (52.3%, a difference of 0.060%), Puerto Rican (52.2%, a difference of 0.19%), Creek (52.2%, a difference of 0.26%), and Immigrants from Dominica (52.5%, a difference of 0.38%).
| Demographics | Rating | Rank | College, 1 year or more |
| Blacks/African Americans | 0.0 /100 | #293 | Tragic 53.3% |
| Cherokee | 0.0 /100 | #294 | Tragic 53.2% |
| Yaqui | 0.0 /100 | #295 | Tragic 53.2% |
| Sioux | 0.0 /100 | #296 | Tragic 53.0% |
| Paiute | 0.0 /100 | #297 | Tragic 52.9% |
| Immigrants | Dominica | 0.0 /100 | #298 | Tragic 52.5% |
| Immigrants | Nicaragua | 0.0 /100 | #299 | Tragic 52.4% |
| Choctaw | 0.0 /100 | #300 | Tragic 52.3% |
| Haitians | 0.0 /100 | #301 | Tragic 52.3% |
| Puerto Ricans | 0.0 /100 | #302 | Tragic 52.2% |
| Creek | 0.0 /100 | #303 | Tragic 52.2% |
| Central Americans | 0.0 /100 | #304 | Tragic 52.1% |
| Seminole | 0.0 /100 | #305 | Tragic 52.1% |
| Mexican American Indians | 0.0 /100 | #306 | Tragic 51.9% |
| Immigrants | Portugal | 0.0 /100 | #307 | Tragic 51.9% |