Immigrants from Afghanistan vs Choctaw College, 1 year or more
COMPARE
Immigrants from Afghanistan
Choctaw
College, 1 year or more
College, 1 year or more Comparison
Immigrants from Afghanistan
Choctaw
60.7%
COLLEGE, 1 YEAR OR MORE
83.1/ 100
METRIC RATING
141st/ 347
METRIC RANK
52.3%
COLLEGE, 1 YEAR OR MORE
0.0/ 100
METRIC RATING
300th/ 347
METRIC RANK
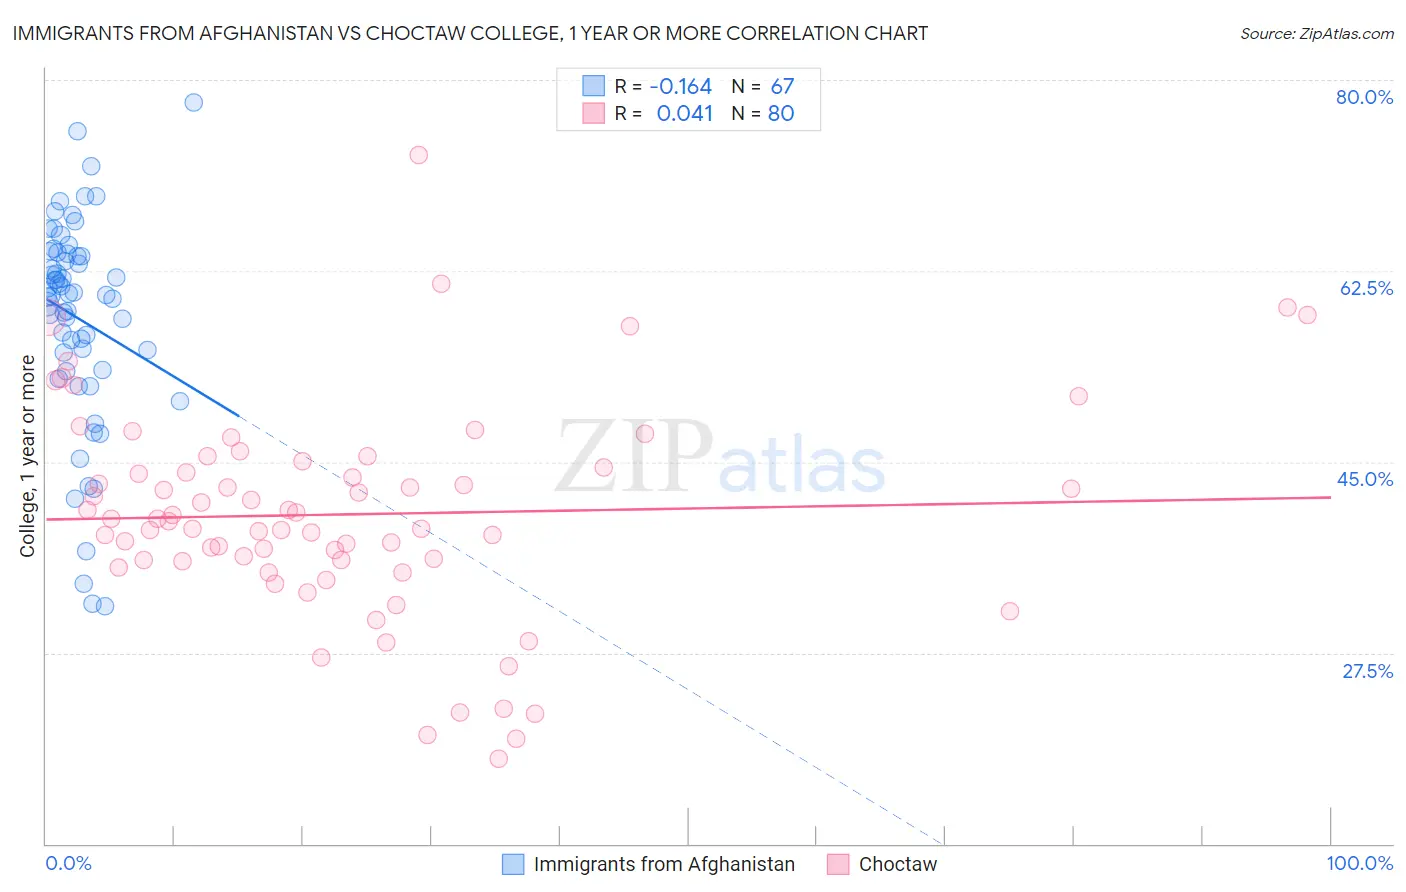
Immigrants from Afghanistan vs Choctaw College, 1 year or more Correlation Chart
The statistical analysis conducted on geographies consisting of 147,646,040 people shows a poor negative correlation between the proportion of Immigrants from Afghanistan and percentage of population with at least college, 1 year or more education in the United States with a correlation coefficient (R) of -0.164 and weighted average of 60.7%. Similarly, the statistical analysis conducted on geographies consisting of 269,741,564 people shows no correlation between the proportion of Choctaw and percentage of population with at least college, 1 year or more education in the United States with a correlation coefficient (R) of 0.041 and weighted average of 52.3%, a difference of 15.9%.
College, 1 year or more Correlation Summary
| Measurement | Immigrants from Afghanistan | Choctaw |
| Minimum | 31.8% | 17.8% |
| Maximum | 78.0% | 73.1% |
| Range | 46.2% | 55.3% |
| Mean | 58.2% | 40.2% |
| Median | 60.3% | 39.7% |
| Interquartile 25% (IQ1) | 53.4% | 35.9% |
| Interquartile 75% (IQ3) | 64.1% | 44.7% |
| Interquartile Range (IQR) | 10.7% | 8.8% |
| Standard Deviation (Sample) | 9.6% | 9.9% |
| Standard Deviation (Population) | 9.5% | 9.8% |
Similar Demographics by College, 1 year or more
Demographics Similar to Immigrants from Afghanistan by College, 1 year or more
In terms of college, 1 year or more, the demographic groups most similar to Immigrants from Afghanistan are Iraqi (60.7%, a difference of 0.020%), Polish (60.7%, a difference of 0.030%), Canadian (60.6%, a difference of 0.040%), Taiwanese (60.7%, a difference of 0.11%), and Immigrants from Eritrea (60.7%, a difference of 0.11%).
| Demographics | Rating | Rank | College, 1 year or more |
| Immigrants | Venezuela | 87.9 /100 | #134 | Excellent 61.0% |
| Immigrants | Uganda | 87.4 /100 | #135 | Excellent 60.9% |
| Basques | 87.2 /100 | #136 | Excellent 60.9% |
| Slovenes | 86.5 /100 | #137 | Excellent 60.9% |
| Taiwanese | 84.3 /100 | #138 | Excellent 60.7% |
| Immigrants | Eritrea | 84.3 /100 | #139 | Excellent 60.7% |
| Iraqis | 83.3 /100 | #140 | Excellent 60.7% |
| Immigrants | Afghanistan | 83.1 /100 | #141 | Excellent 60.7% |
| Poles | 82.8 /100 | #142 | Excellent 60.7% |
| Canadians | 82.7 /100 | #143 | Excellent 60.6% |
| Czechs | 81.9 /100 | #144 | Excellent 60.6% |
| Slavs | 81.1 /100 | #145 | Excellent 60.6% |
| Scottish | 80.2 /100 | #146 | Excellent 60.5% |
| Immigrants | Kenya | 79.1 /100 | #147 | Good 60.5% |
| Kenyans | 79.0 /100 | #148 | Good 60.5% |
Demographics Similar to Choctaw by College, 1 year or more
In terms of college, 1 year or more, the demographic groups most similar to Choctaw are Immigrants from Nicaragua (52.4%, a difference of 0.040%), Haitian (52.3%, a difference of 0.060%), Puerto Rican (52.2%, a difference of 0.19%), Creek (52.2%, a difference of 0.26%), and Immigrants from Dominica (52.5%, a difference of 0.38%).
| Demographics | Rating | Rank | College, 1 year or more |
| Blacks/African Americans | 0.0 /100 | #293 | Tragic 53.3% |
| Cherokee | 0.0 /100 | #294 | Tragic 53.2% |
| Yaqui | 0.0 /100 | #295 | Tragic 53.2% |
| Sioux | 0.0 /100 | #296 | Tragic 53.0% |
| Paiute | 0.0 /100 | #297 | Tragic 52.9% |
| Immigrants | Dominica | 0.0 /100 | #298 | Tragic 52.5% |
| Immigrants | Nicaragua | 0.0 /100 | #299 | Tragic 52.4% |
| Choctaw | 0.0 /100 | #300 | Tragic 52.3% |
| Haitians | 0.0 /100 | #301 | Tragic 52.3% |
| Puerto Ricans | 0.0 /100 | #302 | Tragic 52.2% |
| Creek | 0.0 /100 | #303 | Tragic 52.2% |
| Central Americans | 0.0 /100 | #304 | Tragic 52.1% |
| Seminole | 0.0 /100 | #305 | Tragic 52.1% |
| Mexican American Indians | 0.0 /100 | #306 | Tragic 51.9% |
| Immigrants | Portugal | 0.0 /100 | #307 | Tragic 51.9% |