Immigrants from Japan vs Choctaw College, 1 year or more
COMPARE
Immigrants from Japan
Choctaw
College, 1 year or more
College, 1 year or more Comparison
Immigrants from Japan
Choctaw
66.7%
COLLEGE, 1 YEAR OR MORE
100.0/ 100
METRIC RATING
16th/ 347
METRIC RANK
52.3%
COLLEGE, 1 YEAR OR MORE
0.0/ 100
METRIC RATING
300th/ 347
METRIC RANK
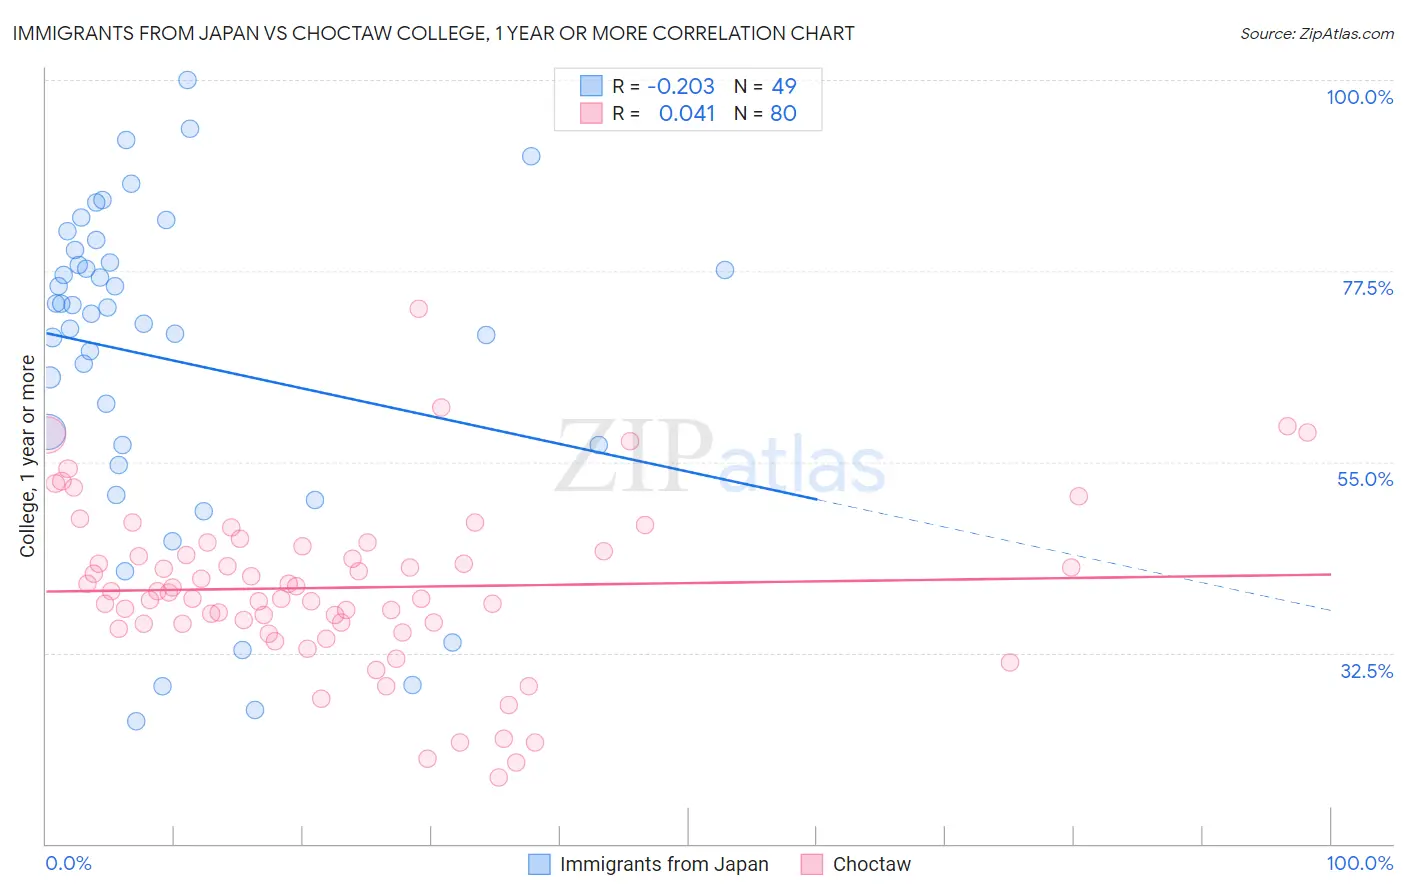
Immigrants from Japan vs Choctaw College, 1 year or more Correlation Chart
The statistical analysis conducted on geographies consisting of 340,147,719 people shows a weak negative correlation between the proportion of Immigrants from Japan and percentage of population with at least college, 1 year or more education in the United States with a correlation coefficient (R) of -0.203 and weighted average of 66.7%. Similarly, the statistical analysis conducted on geographies consisting of 269,741,564 people shows no correlation between the proportion of Choctaw and percentage of population with at least college, 1 year or more education in the United States with a correlation coefficient (R) of 0.041 and weighted average of 52.3%, a difference of 27.4%.
College, 1 year or more Correlation Summary
| Measurement | Immigrants from Japan | Choctaw |
| Minimum | 24.4% | 17.8% |
| Maximum | 100.0% | 73.1% |
| Range | 75.6% | 55.3% |
| Mean | 67.0% | 40.2% |
| Median | 72.5% | 39.7% |
| Interquartile 25% (IQ1) | 55.8% | 35.9% |
| Interquartile 75% (IQ3) | 79.2% | 44.7% |
| Interquartile Range (IQR) | 23.4% | 8.8% |
| Standard Deviation (Sample) | 19.1% | 9.9% |
| Standard Deviation (Population) | 18.9% | 9.8% |
Similar Demographics by College, 1 year or more
Demographics Similar to Immigrants from Japan by College, 1 year or more
In terms of college, 1 year or more, the demographic groups most similar to Immigrants from Japan are Cambodian (66.7%, a difference of 0.030%), Burmese (66.7%, a difference of 0.040%), Immigrants from Eastern Asia (66.6%, a difference of 0.11%), Eastern European (66.6%, a difference of 0.19%), and Immigrants from Sweden (66.8%, a difference of 0.23%).
| Demographics | Rating | Rank | College, 1 year or more |
| Immigrants | Israel | 100.0 /100 | #9 | Exceptional 67.8% |
| Immigrants | Australia | 100.0 /100 | #10 | Exceptional 67.7% |
| Immigrants | South Central Asia | 100.0 /100 | #11 | Exceptional 67.1% |
| Cypriots | 100.0 /100 | #12 | Exceptional 67.0% |
| Immigrants | Sweden | 100.0 /100 | #13 | Exceptional 66.8% |
| Burmese | 100.0 /100 | #14 | Exceptional 66.7% |
| Cambodians | 100.0 /100 | #15 | Exceptional 66.7% |
| Immigrants | Japan | 100.0 /100 | #16 | Exceptional 66.7% |
| Immigrants | Eastern Asia | 100.0 /100 | #17 | Exceptional 66.6% |
| Eastern Europeans | 100.0 /100 | #18 | Exceptional 66.6% |
| Immigrants | Switzerland | 100.0 /100 | #19 | Exceptional 66.5% |
| Immigrants | Korea | 100.0 /100 | #20 | Exceptional 66.5% |
| Immigrants | Hong Kong | 100.0 /100 | #21 | Exceptional 66.4% |
| Soviet Union | 100.0 /100 | #22 | Exceptional 66.4% |
| Immigrants | China | 100.0 /100 | #23 | Exceptional 66.4% |
Demographics Similar to Choctaw by College, 1 year or more
In terms of college, 1 year or more, the demographic groups most similar to Choctaw are Immigrants from Nicaragua (52.4%, a difference of 0.040%), Haitian (52.3%, a difference of 0.060%), Puerto Rican (52.2%, a difference of 0.19%), Creek (52.2%, a difference of 0.26%), and Immigrants from Dominica (52.5%, a difference of 0.38%).
| Demographics | Rating | Rank | College, 1 year or more |
| Blacks/African Americans | 0.0 /100 | #293 | Tragic 53.3% |
| Cherokee | 0.0 /100 | #294 | Tragic 53.2% |
| Yaqui | 0.0 /100 | #295 | Tragic 53.2% |
| Sioux | 0.0 /100 | #296 | Tragic 53.0% |
| Paiute | 0.0 /100 | #297 | Tragic 52.9% |
| Immigrants | Dominica | 0.0 /100 | #298 | Tragic 52.5% |
| Immigrants | Nicaragua | 0.0 /100 | #299 | Tragic 52.4% |
| Choctaw | 0.0 /100 | #300 | Tragic 52.3% |
| Haitians | 0.0 /100 | #301 | Tragic 52.3% |
| Puerto Ricans | 0.0 /100 | #302 | Tragic 52.2% |
| Creek | 0.0 /100 | #303 | Tragic 52.2% |
| Central Americans | 0.0 /100 | #304 | Tragic 52.1% |
| Seminole | 0.0 /100 | #305 | Tragic 52.1% |
| Mexican American Indians | 0.0 /100 | #306 | Tragic 51.9% |
| Immigrants | Portugal | 0.0 /100 | #307 | Tragic 51.9% |