Immigrants from Chile vs Choctaw Male Unemployment
COMPARE
Immigrants from Chile
Choctaw
Male Unemployment
Male Unemployment Comparison
Immigrants from Chile
Choctaw
5.1%
MALE UNEMPLOYMENT
91.8/ 100
METRIC RATING
104th/ 347
METRIC RANK
5.6%
MALE UNEMPLOYMENT
1.6/ 100
METRIC RATING
231st/ 347
METRIC RANK
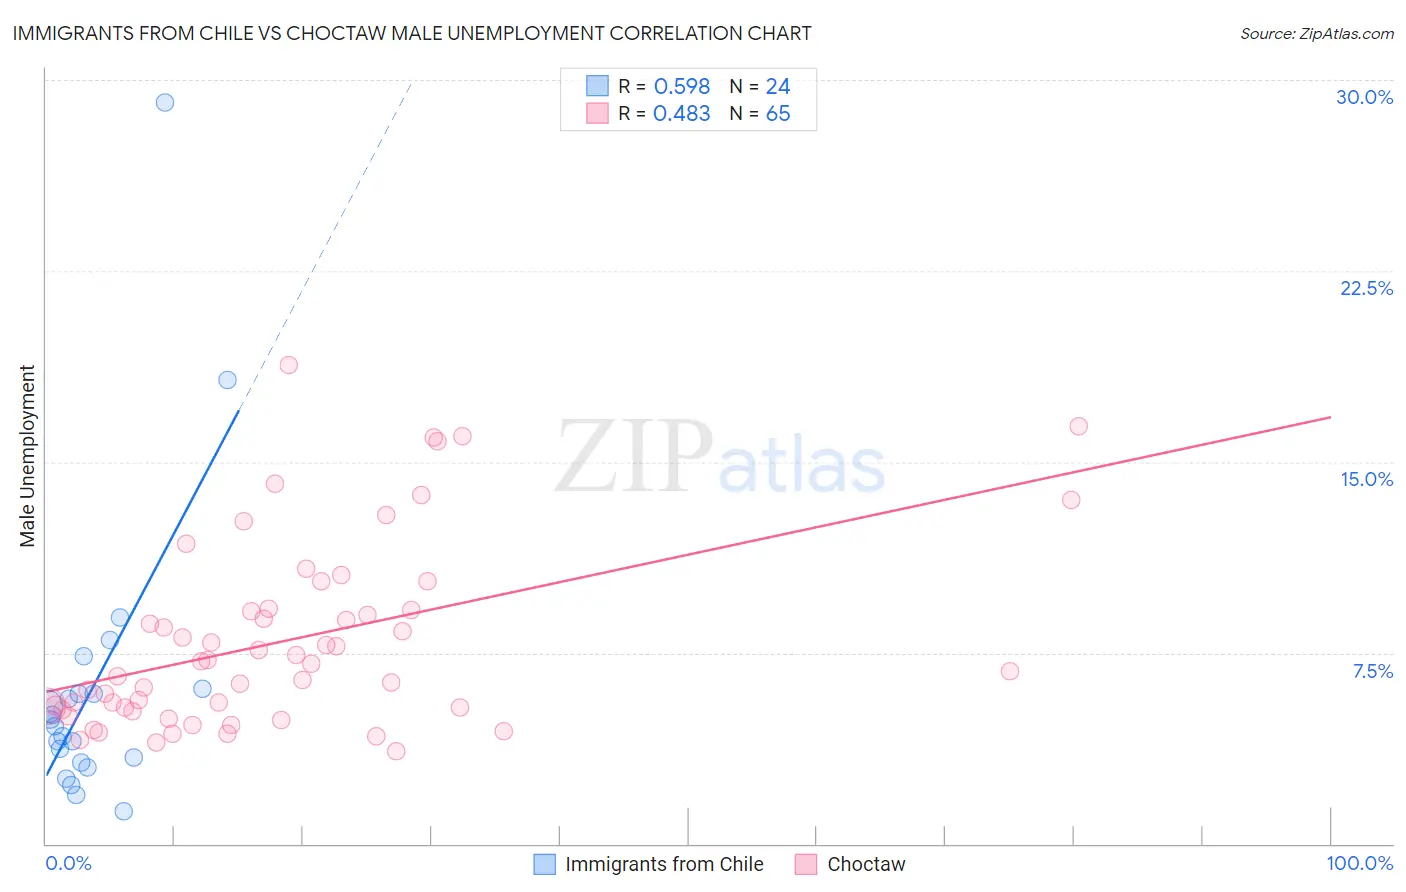
Immigrants from Chile vs Choctaw Male Unemployment Correlation Chart
The statistical analysis conducted on geographies consisting of 218,334,773 people shows a substantial positive correlation between the proportion of Immigrants from Chile and unemployment rate among males in the United States with a correlation coefficient (R) of 0.598 and weighted average of 5.1%. Similarly, the statistical analysis conducted on geographies consisting of 268,476,218 people shows a moderate positive correlation between the proportion of Choctaw and unemployment rate among males in the United States with a correlation coefficient (R) of 0.483 and weighted average of 5.6%, a difference of 9.8%.
Male Unemployment Correlation Summary
| Measurement | Immigrants from Chile | Choctaw |
| Minimum | 1.3% | 3.6% |
| Maximum | 29.1% | 18.8% |
| Range | 27.8% | 15.2% |
| Mean | 6.2% | 8.0% |
| Median | 4.8% | 7.1% |
| Interquartile 25% (IQ1) | 3.3% | 5.3% |
| Interquartile 75% (IQ3) | 6.0% | 9.2% |
| Interquartile Range (IQR) | 2.7% | 3.9% |
| Standard Deviation (Sample) | 5.9% | 3.6% |
| Standard Deviation (Population) | 5.8% | 3.6% |
Similar Demographics by Male Unemployment
Demographics Similar to Immigrants from Chile by Male Unemployment
In terms of male unemployment, the demographic groups most similar to Immigrants from Chile are Immigrants from Czechoslovakia (5.1%, a difference of 0.010%), Immigrants from Jordan (5.1%, a difference of 0.030%), Immigrants from Ethiopia (5.1%, a difference of 0.050%), Ethiopian (5.1%, a difference of 0.090%), and Immigrants from Nicaragua (5.1%, a difference of 0.10%).
| Demographics | Rating | Rank | Male Unemployment |
| Immigrants | Spain | 93.4 /100 | #97 | Exceptional 5.1% |
| Immigrants | Kuwait | 93.3 /100 | #98 | Exceptional 5.1% |
| Uruguayans | 93.0 /100 | #99 | Exceptional 5.1% |
| Russians | 92.9 /100 | #100 | Exceptional 5.1% |
| German Russians | 92.7 /100 | #101 | Exceptional 5.1% |
| Immigrants | France | 92.7 /100 | #102 | Exceptional 5.1% |
| Immigrants | Jordan | 91.9 /100 | #103 | Exceptional 5.1% |
| Immigrants | Chile | 91.8 /100 | #104 | Exceptional 5.1% |
| Immigrants | Czechoslovakia | 91.7 /100 | #105 | Exceptional 5.1% |
| Immigrants | Ethiopia | 91.5 /100 | #106 | Exceptional 5.1% |
| Ethiopians | 91.3 /100 | #107 | Exceptional 5.1% |
| Immigrants | Nicaragua | 91.2 /100 | #108 | Exceptional 5.1% |
| Immigrants | Pakistan | 90.9 /100 | #109 | Exceptional 5.1% |
| Immigrants | England | 90.8 /100 | #110 | Exceptional 5.1% |
| Immigrants | Eastern Asia | 90.8 /100 | #111 | Exceptional 5.1% |
Demographics Similar to Choctaw by Male Unemployment
In terms of male unemployment, the demographic groups most similar to Choctaw are Moroccan (5.6%, a difference of 0.030%), Immigrants from Africa (5.6%, a difference of 0.050%), Central American (5.6%, a difference of 0.090%), Seminole (5.6%, a difference of 0.10%), and Immigrants from Panama (5.6%, a difference of 0.11%).
| Demographics | Rating | Rank | Male Unemployment |
| Cherokee | 2.4 /100 | #224 | Tragic 5.6% |
| Panamanians | 1.9 /100 | #225 | Tragic 5.6% |
| Immigrants | Cambodia | 1.8 /100 | #226 | Tragic 5.6% |
| Immigrants | Panama | 1.8 /100 | #227 | Tragic 5.6% |
| Seminole | 1.8 /100 | #228 | Tragic 5.6% |
| Central Americans | 1.8 /100 | #229 | Tragic 5.6% |
| Immigrants | Africa | 1.7 /100 | #230 | Tragic 5.6% |
| Choctaw | 1.6 /100 | #231 | Tragic 5.6% |
| Moroccans | 1.6 /100 | #232 | Tragic 5.6% |
| Somalis | 1.5 /100 | #233 | Tragic 5.6% |
| Immigrants | Somalia | 1.5 /100 | #234 | Tragic 5.6% |
| Immigrants | Honduras | 1.5 /100 | #235 | Tragic 5.6% |
| Guatemalans | 1.2 /100 | #236 | Tragic 5.6% |
| Hondurans | 1.1 /100 | #237 | Tragic 5.6% |
| Native Hawaiians | 1.1 /100 | #238 | Tragic 5.6% |