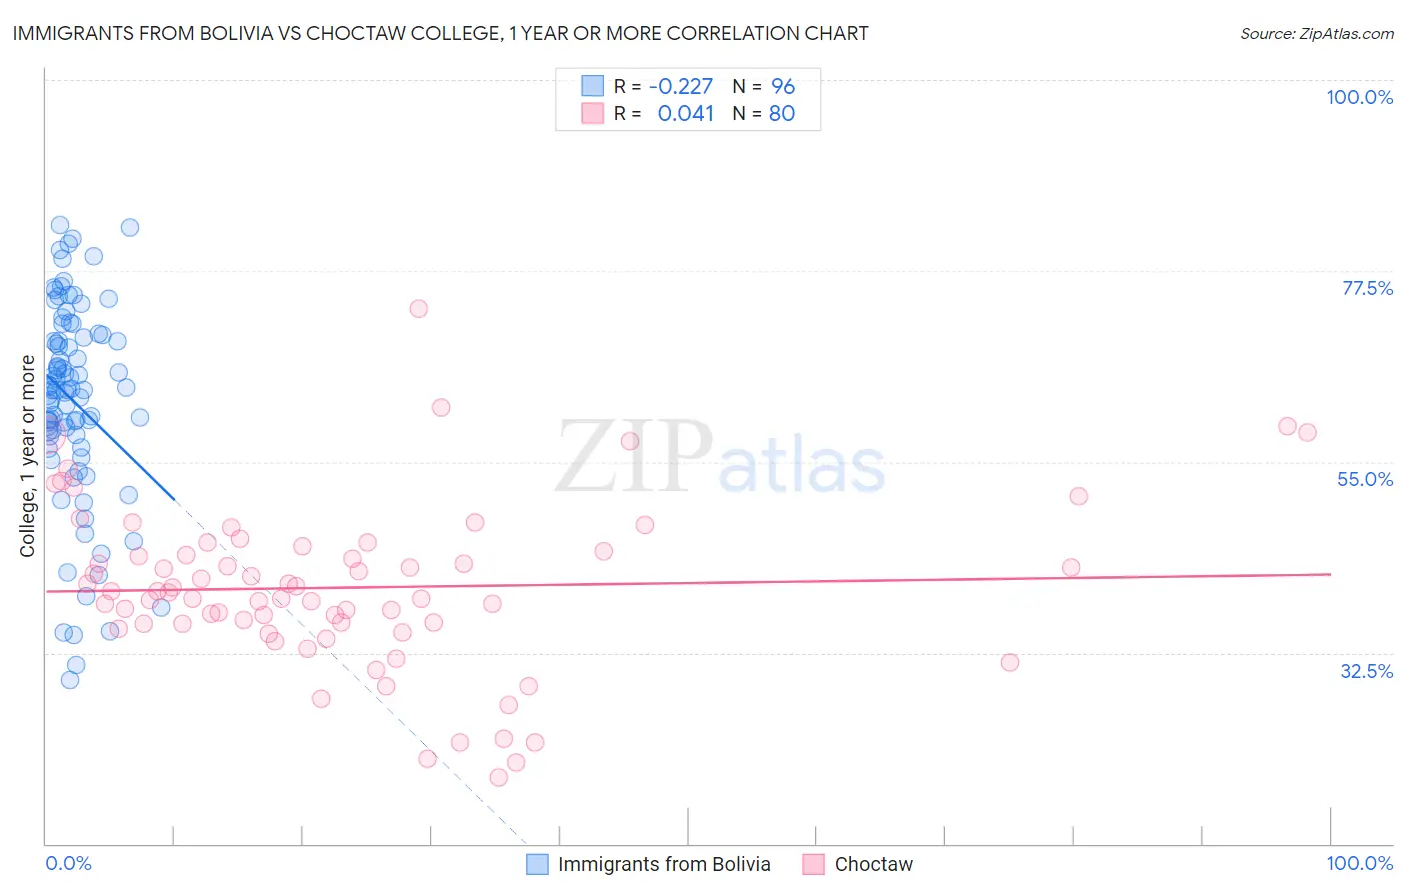
Immigrants from Bolivia vs Choctaw College, 1 year or more
COMPARE
Immigrants from Bolivia
Choctaw
College, 1 year or more
College, 1 year or more Comparison
Immigrants from Bolivia
Choctaw
62.8%
COLLEGE, 1 YEAR OR MORE
98.7/ 100
METRIC RATING
82nd/ 347
METRIC RANK
52.3%
COLLEGE, 1 YEAR OR MORE
0.0/ 100
METRIC RATING
300th/ 347
METRIC RANK
Immigrants from Bolivia vs Choctaw College, 1 year or more Correlation Chart
The statistical analysis conducted on geographies consisting of 158,732,804 people shows a weak negative correlation between the proportion of Immigrants from Bolivia and percentage of population with at least college, 1 year or more education in the United States with a correlation coefficient (R) of -0.227 and weighted average of 62.8%. Similarly, the statistical analysis conducted on geographies consisting of 269,741,564 people shows no correlation between the proportion of Choctaw and percentage of population with at least college, 1 year or more education in the United States with a correlation coefficient (R) of 0.041 and weighted average of 52.3%, a difference of 20.0%.
College, 1 year or more Correlation Summary
| Measurement | Immigrants from Bolivia | Choctaw |
| Minimum | 29.3% | 17.8% |
| Maximum | 82.9% | 73.1% |
| Range | 53.5% | 55.3% |
| Mean | 62.2% | 40.2% |
| Median | 63.5% | 39.7% |
| Interquartile 25% (IQ1) | 58.1% | 35.9% |
| Interquartile 75% (IQ3) | 69.8% | 44.7% |
| Interquartile Range (IQR) | 11.7% | 8.8% |
| Standard Deviation (Sample) | 11.9% | 9.9% |
| Standard Deviation (Population) | 11.8% | 9.8% |
Similar Demographics by College, 1 year or more
Demographics Similar to Immigrants from Bolivia by College, 1 year or more
In terms of college, 1 year or more, the demographic groups most similar to Immigrants from Bolivia are Immigrants from Argentina (62.8%, a difference of 0.040%), Laotian (62.8%, a difference of 0.050%), Immigrants from England (62.8%, a difference of 0.070%), Immigrants from Pakistan (62.8%, a difference of 0.080%), and Lithuanian (62.9%, a difference of 0.10%).
| Demographics | Rating | Rank | College, 1 year or more |
| Armenians | 98.9 /100 | #75 | Exceptional 63.0% |
| Paraguayans | 98.8 /100 | #76 | Exceptional 62.9% |
| Ethiopians | 98.8 /100 | #77 | Exceptional 62.9% |
| Immigrants | Lebanon | 98.8 /100 | #78 | Exceptional 62.9% |
| Northern Europeans | 98.8 /100 | #79 | Exceptional 62.9% |
| Lithuanians | 98.8 /100 | #80 | Exceptional 62.9% |
| Laotians | 98.7 /100 | #81 | Exceptional 62.8% |
| Immigrants | Bolivia | 98.7 /100 | #82 | Exceptional 62.8% |
| Immigrants | Argentina | 98.6 /100 | #83 | Exceptional 62.8% |
| Immigrants | England | 98.6 /100 | #84 | Exceptional 62.8% |
| Immigrants | Pakistan | 98.6 /100 | #85 | Exceptional 62.8% |
| Immigrants | Western Europe | 98.6 /100 | #86 | Exceptional 62.7% |
| Immigrants | Hungary | 98.6 /100 | #87 | Exceptional 62.7% |
| Greeks | 98.3 /100 | #88 | Exceptional 62.6% |
| Immigrants | Ethiopia | 98.2 /100 | #89 | Exceptional 62.6% |
Demographics Similar to Choctaw by College, 1 year or more
In terms of college, 1 year or more, the demographic groups most similar to Choctaw are Immigrants from Nicaragua (52.4%, a difference of 0.040%), Haitian (52.3%, a difference of 0.060%), Puerto Rican (52.2%, a difference of 0.19%), Creek (52.2%, a difference of 0.26%), and Immigrants from Dominica (52.5%, a difference of 0.38%).
| Demographics | Rating | Rank | College, 1 year or more |
| Blacks/African Americans | 0.0 /100 | #293 | Tragic 53.3% |
| Cherokee | 0.0 /100 | #294 | Tragic 53.2% |
| Yaqui | 0.0 /100 | #295 | Tragic 53.2% |
| Sioux | 0.0 /100 | #296 | Tragic 53.0% |
| Paiute | 0.0 /100 | #297 | Tragic 52.9% |
| Immigrants | Dominica | 0.0 /100 | #298 | Tragic 52.5% |
| Immigrants | Nicaragua | 0.0 /100 | #299 | Tragic 52.4% |
| Choctaw | 0.0 /100 | #300 | Tragic 52.3% |
| Haitians | 0.0 /100 | #301 | Tragic 52.3% |
| Puerto Ricans | 0.0 /100 | #302 | Tragic 52.2% |
| Creek | 0.0 /100 | #303 | Tragic 52.2% |
| Central Americans | 0.0 /100 | #304 | Tragic 52.1% |
| Seminole | 0.0 /100 | #305 | Tragic 52.1% |
| Mexican American Indians | 0.0 /100 | #306 | Tragic 51.9% |
| Immigrants | Portugal | 0.0 /100 | #307 | Tragic 51.9% |