Immigrants from Austria vs Choctaw College, 1 year or more
COMPARE
Immigrants from Austria
Choctaw
College, 1 year or more
College, 1 year or more Comparison
Immigrants from Austria
Choctaw
64.4%
COLLEGE, 1 YEAR OR MORE
99.8/ 100
METRIC RATING
50th/ 347
METRIC RANK
52.3%
COLLEGE, 1 YEAR OR MORE
0.0/ 100
METRIC RATING
300th/ 347
METRIC RANK
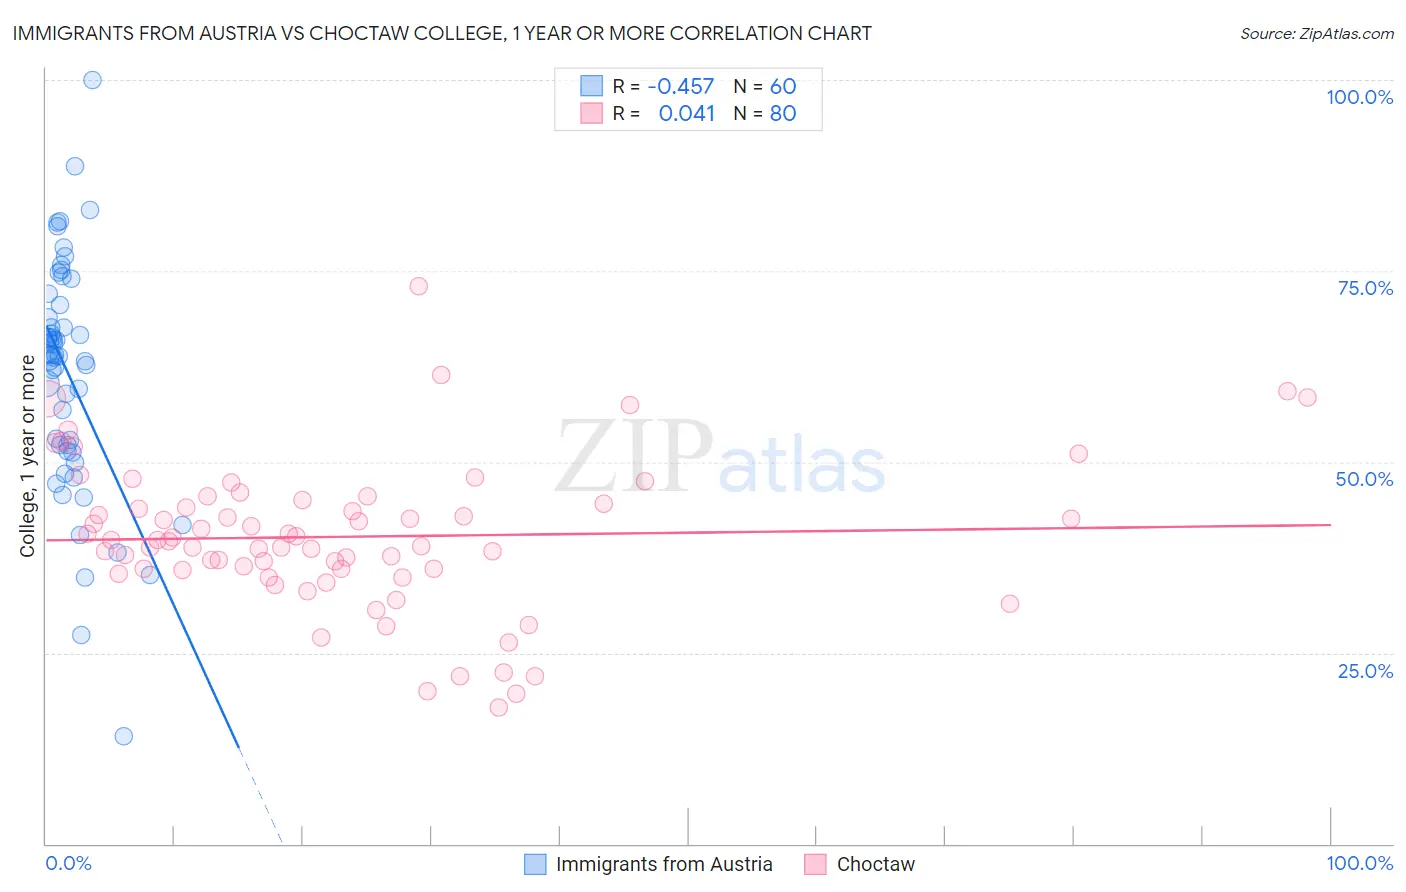
Immigrants from Austria vs Choctaw College, 1 year or more Correlation Chart
The statistical analysis conducted on geographies consisting of 167,973,933 people shows a moderate negative correlation between the proportion of Immigrants from Austria and percentage of population with at least college, 1 year or more education in the United States with a correlation coefficient (R) of -0.457 and weighted average of 64.4%. Similarly, the statistical analysis conducted on geographies consisting of 269,741,564 people shows no correlation between the proportion of Choctaw and percentage of population with at least college, 1 year or more education in the United States with a correlation coefficient (R) of 0.041 and weighted average of 52.3%, a difference of 23.0%.
College, 1 year or more Correlation Summary
| Measurement | Immigrants from Austria | Choctaw |
| Minimum | 14.1% | 17.8% |
| Maximum | 100.0% | 73.1% |
| Range | 85.9% | 55.3% |
| Mean | 61.4% | 40.2% |
| Median | 63.9% | 39.7% |
| Interquartile 25% (IQ1) | 51.8% | 35.9% |
| Interquartile 75% (IQ3) | 69.7% | 44.7% |
| Interquartile Range (IQR) | 17.9% | 8.8% |
| Standard Deviation (Sample) | 15.3% | 9.9% |
| Standard Deviation (Population) | 15.1% | 9.8% |
Similar Demographics by College, 1 year or more
Demographics Similar to Immigrants from Austria by College, 1 year or more
In terms of college, 1 year or more, the demographic groups most similar to Immigrants from Austria are Immigrants from Malaysia (64.3%, a difference of 0.080%), Immigrants from Netherlands (64.2%, a difference of 0.24%), Asian (64.2%, a difference of 0.26%), New Zealander (64.6%, a difference of 0.29%), and Zimbabwean (64.2%, a difference of 0.29%).
| Demographics | Rating | Rank | College, 1 year or more |
| Immigrants | Russia | 99.9 /100 | #43 | Exceptional 64.7% |
| Immigrants | Norway | 99.9 /100 | #44 | Exceptional 64.7% |
| Immigrants | Lithuania | 99.9 /100 | #45 | Exceptional 64.6% |
| Bhutanese | 99.9 /100 | #46 | Exceptional 64.6% |
| Australians | 99.9 /100 | #47 | Exceptional 64.6% |
| Immigrants | Bulgaria | 99.9 /100 | #48 | Exceptional 64.6% |
| New Zealanders | 99.9 /100 | #49 | Exceptional 64.6% |
| Immigrants | Austria | 99.8 /100 | #50 | Exceptional 64.4% |
| Immigrants | Malaysia | 99.8 /100 | #51 | Exceptional 64.3% |
| Immigrants | Netherlands | 99.8 /100 | #52 | Exceptional 64.2% |
| Asians | 99.8 /100 | #53 | Exceptional 64.2% |
| Zimbabweans | 99.8 /100 | #54 | Exceptional 64.2% |
| Immigrants | Belarus | 99.7 /100 | #55 | Exceptional 64.1% |
| Immigrants | Czechoslovakia | 99.7 /100 | #56 | Exceptional 64.1% |
| South Africans | 99.7 /100 | #57 | Exceptional 64.1% |
Demographics Similar to Choctaw by College, 1 year or more
In terms of college, 1 year or more, the demographic groups most similar to Choctaw are Immigrants from Nicaragua (52.4%, a difference of 0.040%), Haitian (52.3%, a difference of 0.060%), Puerto Rican (52.2%, a difference of 0.19%), Creek (52.2%, a difference of 0.26%), and Immigrants from Dominica (52.5%, a difference of 0.38%).
| Demographics | Rating | Rank | College, 1 year or more |
| Blacks/African Americans | 0.0 /100 | #293 | Tragic 53.3% |
| Cherokee | 0.0 /100 | #294 | Tragic 53.2% |
| Yaqui | 0.0 /100 | #295 | Tragic 53.2% |
| Sioux | 0.0 /100 | #296 | Tragic 53.0% |
| Paiute | 0.0 /100 | #297 | Tragic 52.9% |
| Immigrants | Dominica | 0.0 /100 | #298 | Tragic 52.5% |
| Immigrants | Nicaragua | 0.0 /100 | #299 | Tragic 52.4% |
| Choctaw | 0.0 /100 | #300 | Tragic 52.3% |
| Haitians | 0.0 /100 | #301 | Tragic 52.3% |
| Puerto Ricans | 0.0 /100 | #302 | Tragic 52.2% |
| Creek | 0.0 /100 | #303 | Tragic 52.2% |
| Central Americans | 0.0 /100 | #304 | Tragic 52.1% |
| Seminole | 0.0 /100 | #305 | Tragic 52.1% |
| Mexican American Indians | 0.0 /100 | #306 | Tragic 51.9% |
| Immigrants | Portugal | 0.0 /100 | #307 | Tragic 51.9% |