Immigrants from Central America vs Cheyenne College, Under 1 year
COMPARE
Immigrants from Central America
Cheyenne
College, Under 1 year
College, Under 1 year Comparison
Immigrants from Central America
Cheyenne
54.4%
COLLEGE, UNDER 1 YEAR
0.0/ 100
METRIC RATING
337th/ 347
METRIC RANK
60.6%
COLLEGE, UNDER 1 YEAR
0.1/ 100
METRIC RATING
270th/ 347
METRIC RANK
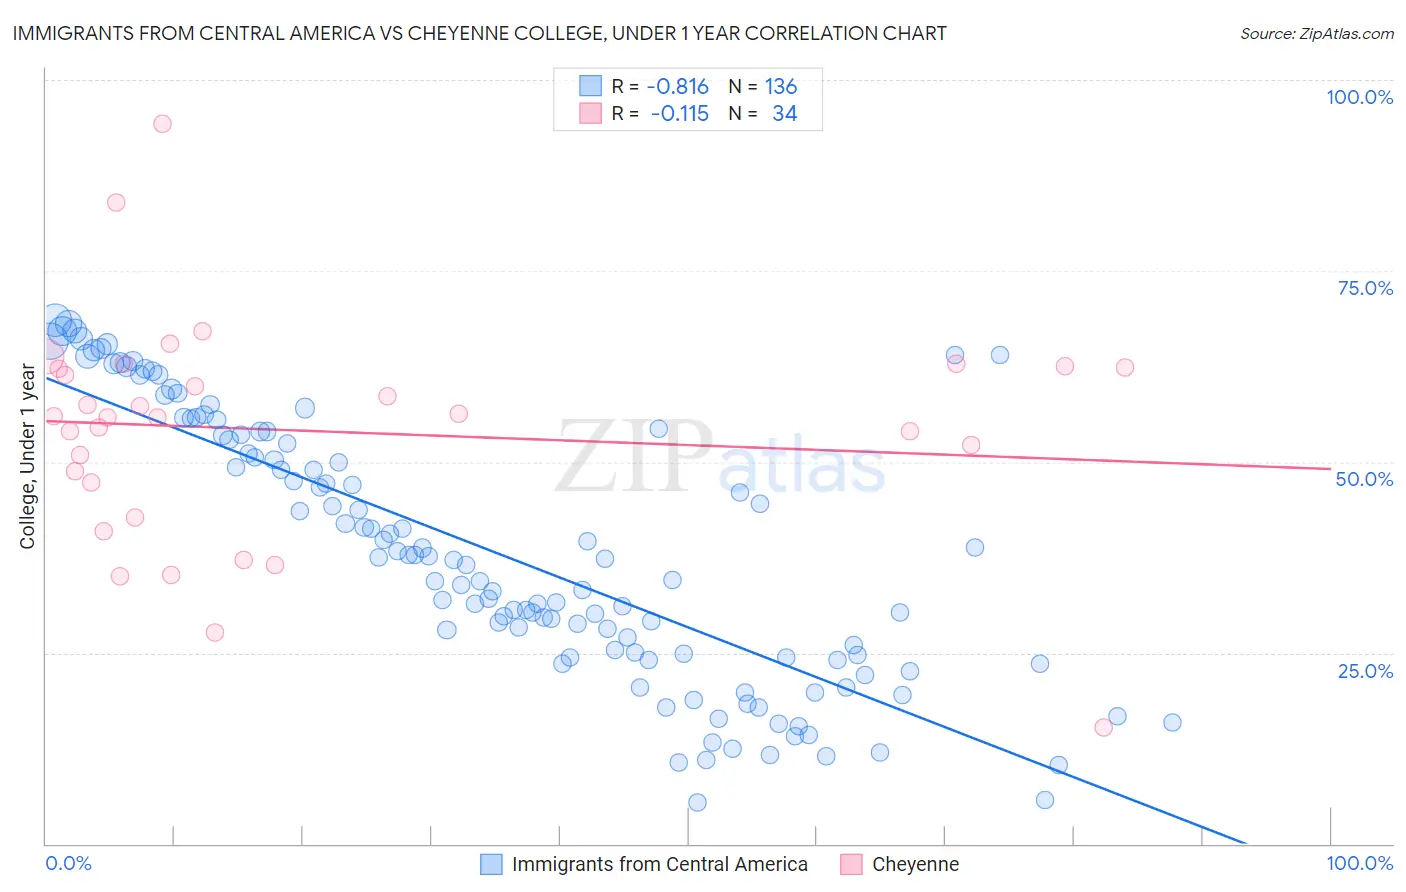
Immigrants from Central America vs Cheyenne College, Under 1 year Correlation Chart
The statistical analysis conducted on geographies consisting of 536,541,976 people shows a very strong negative correlation between the proportion of Immigrants from Central America and percentage of population with at least college, under 1 year education in the United States with a correlation coefficient (R) of -0.816 and weighted average of 54.4%. Similarly, the statistical analysis conducted on geographies consisting of 80,719,411 people shows a poor negative correlation between the proportion of Cheyenne and percentage of population with at least college, under 1 year education in the United States with a correlation coefficient (R) of -0.115 and weighted average of 60.6%, a difference of 11.3%.
College, Under 1 year Correlation Summary
| Measurement | Immigrants from Central America | Cheyenne |
| Minimum | 5.4% | 15.3% |
| Maximum | 68.5% | 94.3% |
| Range | 63.2% | 79.1% |
| Mean | 38.1% | 54.1% |
| Median | 37.3% | 55.9% |
| Interquartile 25% (IQ1) | 24.5% | 47.3% |
| Interquartile 75% (IQ3) | 53.5% | 62.4% |
| Interquartile Range (IQR) | 29.0% | 15.0% |
| Standard Deviation (Sample) | 17.1% | 14.9% |
| Standard Deviation (Population) | 17.0% | 14.7% |
Similar Demographics by College, Under 1 year
Demographics Similar to Immigrants from Central America by College, Under 1 year
In terms of college, under 1 year, the demographic groups most similar to Immigrants from Central America are Pennsylvania German (54.5%, a difference of 0.15%), Inupiat (54.6%, a difference of 0.32%), Lumbee (54.2%, a difference of 0.41%), Immigrants from the Azores (54.7%, a difference of 0.45%), and Immigrants from Dominican Republic (54.0%, a difference of 0.81%).
| Demographics | Rating | Rank | College, Under 1 year |
| Mexicans | 0.0 /100 | #330 | Tragic 55.6% |
| Dominicans | 0.0 /100 | #331 | Tragic 55.5% |
| Immigrants | Yemen | 0.0 /100 | #332 | Tragic 55.3% |
| Yuman | 0.0 /100 | #333 | Tragic 55.1% |
| Immigrants | Azores | 0.0 /100 | #334 | Tragic 54.7% |
| Inupiat | 0.0 /100 | #335 | Tragic 54.6% |
| Pennsylvania Germans | 0.0 /100 | #336 | Tragic 54.5% |
| Immigrants | Central America | 0.0 /100 | #337 | Tragic 54.4% |
| Lumbee | 0.0 /100 | #338 | Tragic 54.2% |
| Immigrants | Dominican Republic | 0.0 /100 | #339 | Tragic 54.0% |
| Spanish American Indians | 0.0 /100 | #340 | Tragic 54.0% |
| Immigrants | Cabo Verde | 0.0 /100 | #341 | Tragic 53.7% |
| Immigrants | Mexico | 0.0 /100 | #342 | Tragic 53.7% |
| Tohono O'odham | 0.0 /100 | #343 | Tragic 52.8% |
| Yakama | 0.0 /100 | #344 | Tragic 52.6% |
Demographics Similar to Cheyenne by College, Under 1 year
In terms of college, under 1 year, the demographic groups most similar to Cheyenne are U.S. Virgin Islander (60.6%, a difference of 0.020%), Immigrants from West Indies (60.6%, a difference of 0.11%), Jamaican (60.5%, a difference of 0.17%), Chickasaw (60.4%, a difference of 0.22%), and Alaska Native (60.4%, a difference of 0.22%).
| Demographics | Rating | Rank | College, Under 1 year |
| Shoshone | 0.2 /100 | #263 | Tragic 61.1% |
| Trinidadians and Tobagonians | 0.2 /100 | #264 | Tragic 61.1% |
| Immigrants | Bahamas | 0.2 /100 | #265 | Tragic 61.1% |
| Alaskan Athabascans | 0.2 /100 | #266 | Tragic 61.0% |
| Americans | 0.2 /100 | #267 | Tragic 61.0% |
| Immigrants | Trinidad and Tobago | 0.1 /100 | #268 | Tragic 60.7% |
| Immigrants | West Indies | 0.1 /100 | #269 | Tragic 60.6% |
| Cheyenne | 0.1 /100 | #270 | Tragic 60.6% |
| U.S. Virgin Islanders | 0.1 /100 | #271 | Tragic 60.6% |
| Jamaicans | 0.1 /100 | #272 | Tragic 60.5% |
| Chickasaw | 0.1 /100 | #273 | Tragic 60.4% |
| Alaska Natives | 0.1 /100 | #274 | Tragic 60.4% |
| Immigrants | Barbados | 0.1 /100 | #275 | Tragic 60.4% |
| Arapaho | 0.1 /100 | #276 | Tragic 60.3% |
| Bahamians | 0.1 /100 | #277 | Tragic 60.3% |