Immigrants from Central America vs Jordanian College, Under 1 year
COMPARE
Immigrants from Central America
Jordanian
College, Under 1 year
College, Under 1 year Comparison
Immigrants from Central America
Jordanians
54.4%
COLLEGE, UNDER 1 YEAR
0.0/ 100
METRIC RATING
337th/ 347
METRIC RANK
68.0%
COLLEGE, UNDER 1 YEAR
97.4/ 100
METRIC RATING
96th/ 347
METRIC RANK
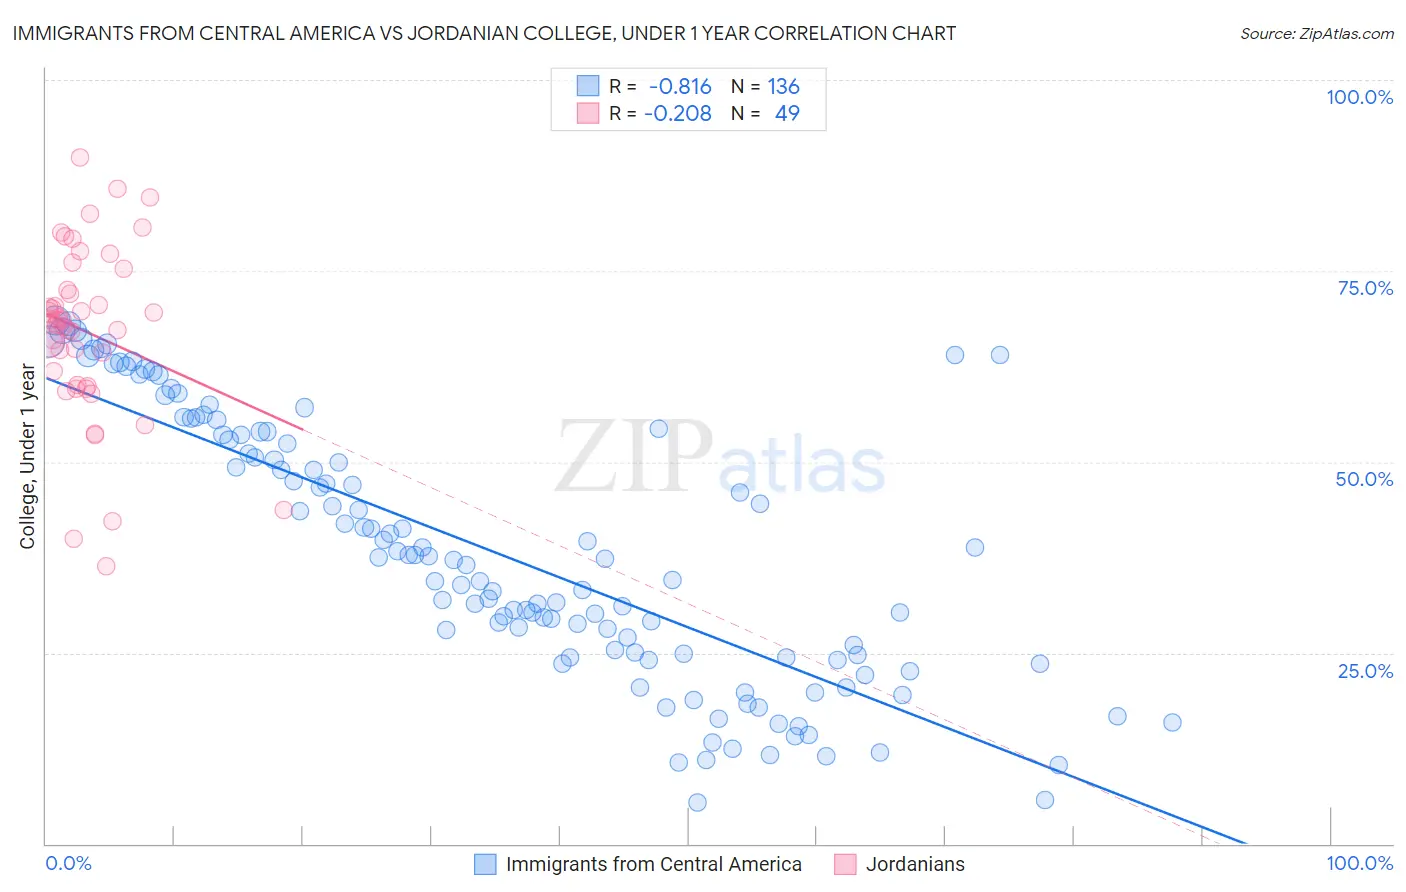
Immigrants from Central America vs Jordanian College, Under 1 year Correlation Chart
The statistical analysis conducted on geographies consisting of 536,541,976 people shows a very strong negative correlation between the proportion of Immigrants from Central America and percentage of population with at least college, under 1 year education in the United States with a correlation coefficient (R) of -0.816 and weighted average of 54.4%. Similarly, the statistical analysis conducted on geographies consisting of 166,424,117 people shows a weak negative correlation between the proportion of Jordanians and percentage of population with at least college, under 1 year education in the United States with a correlation coefficient (R) of -0.208 and weighted average of 68.0%, a difference of 25.0%.
College, Under 1 year Correlation Summary
| Measurement | Immigrants from Central America | Jordanian |
| Minimum | 5.4% | 36.4% |
| Maximum | 68.5% | 89.8% |
| Range | 63.2% | 53.4% |
| Mean | 38.1% | 67.0% |
| Median | 37.3% | 68.5% |
| Interquartile 25% (IQ1) | 24.5% | 60.0% |
| Interquartile 75% (IQ3) | 53.5% | 74.0% |
| Interquartile Range (IQR) | 29.0% | 14.0% |
| Standard Deviation (Sample) | 17.1% | 11.5% |
| Standard Deviation (Population) | 17.0% | 11.3% |
Similar Demographics by College, Under 1 year
Demographics Similar to Immigrants from Central America by College, Under 1 year
In terms of college, under 1 year, the demographic groups most similar to Immigrants from Central America are Pennsylvania German (54.5%, a difference of 0.15%), Inupiat (54.6%, a difference of 0.32%), Lumbee (54.2%, a difference of 0.41%), Immigrants from the Azores (54.7%, a difference of 0.45%), and Immigrants from Dominican Republic (54.0%, a difference of 0.81%).
| Demographics | Rating | Rank | College, Under 1 year |
| Mexicans | 0.0 /100 | #330 | Tragic 55.6% |
| Dominicans | 0.0 /100 | #331 | Tragic 55.5% |
| Immigrants | Yemen | 0.0 /100 | #332 | Tragic 55.3% |
| Yuman | 0.0 /100 | #333 | Tragic 55.1% |
| Immigrants | Azores | 0.0 /100 | #334 | Tragic 54.7% |
| Inupiat | 0.0 /100 | #335 | Tragic 54.6% |
| Pennsylvania Germans | 0.0 /100 | #336 | Tragic 54.5% |
| Immigrants | Central America | 0.0 /100 | #337 | Tragic 54.4% |
| Lumbee | 0.0 /100 | #338 | Tragic 54.2% |
| Immigrants | Dominican Republic | 0.0 /100 | #339 | Tragic 54.0% |
| Spanish American Indians | 0.0 /100 | #340 | Tragic 54.0% |
| Immigrants | Cabo Verde | 0.0 /100 | #341 | Tragic 53.7% |
| Immigrants | Mexico | 0.0 /100 | #342 | Tragic 53.7% |
| Tohono O'odham | 0.0 /100 | #343 | Tragic 52.8% |
| Yakama | 0.0 /100 | #344 | Tragic 52.6% |
Demographics Similar to Jordanians by College, Under 1 year
In terms of college, under 1 year, the demographic groups most similar to Jordanians are Immigrants from Pakistan (68.0%, a difference of 0.030%), Immigrants from Ethiopia (68.0%, a difference of 0.030%), Armenian (68.1%, a difference of 0.13%), Paraguayan (67.9%, a difference of 0.13%), and Immigrants from Bolivia (67.9%, a difference of 0.15%).
| Demographics | Rating | Rank | College, Under 1 year |
| Ethiopians | 98.2 /100 | #89 | Exceptional 68.3% |
| Icelanders | 98.1 /100 | #90 | Exceptional 68.3% |
| Europeans | 98.1 /100 | #91 | Exceptional 68.2% |
| Luxembourgers | 98.1 /100 | #92 | Exceptional 68.2% |
| Romanians | 97.9 /100 | #93 | Exceptional 68.2% |
| Armenians | 97.7 /100 | #94 | Exceptional 68.1% |
| Immigrants | Pakistan | 97.5 /100 | #95 | Exceptional 68.0% |
| Jordanians | 97.4 /100 | #96 | Exceptional 68.0% |
| Immigrants | Ethiopia | 97.3 /100 | #97 | Exceptional 68.0% |
| Paraguayans | 97.1 /100 | #98 | Exceptional 67.9% |
| Immigrants | Bolivia | 97.0 /100 | #99 | Exceptional 67.9% |
| Immigrants | Argentina | 97.0 /100 | #100 | Exceptional 67.9% |
| Immigrants | Eastern Europe | 96.9 /100 | #101 | Exceptional 67.9% |
| Palestinians | 96.9 /100 | #102 | Exceptional 67.9% |
| Carpatho Rusyns | 96.8 /100 | #103 | Exceptional 67.9% |