Immigrants from Central America vs Welsh College, Under 1 year
COMPARE
Immigrants from Central America
Welsh
College, Under 1 year
College, Under 1 year Comparison
Immigrants from Central America
Welsh
54.4%
COLLEGE, UNDER 1 YEAR
0.0/ 100
METRIC RATING
337th/ 347
METRIC RANK
66.0%
COLLEGE, UNDER 1 YEAR
69.9/ 100
METRIC RATING
156th/ 347
METRIC RANK
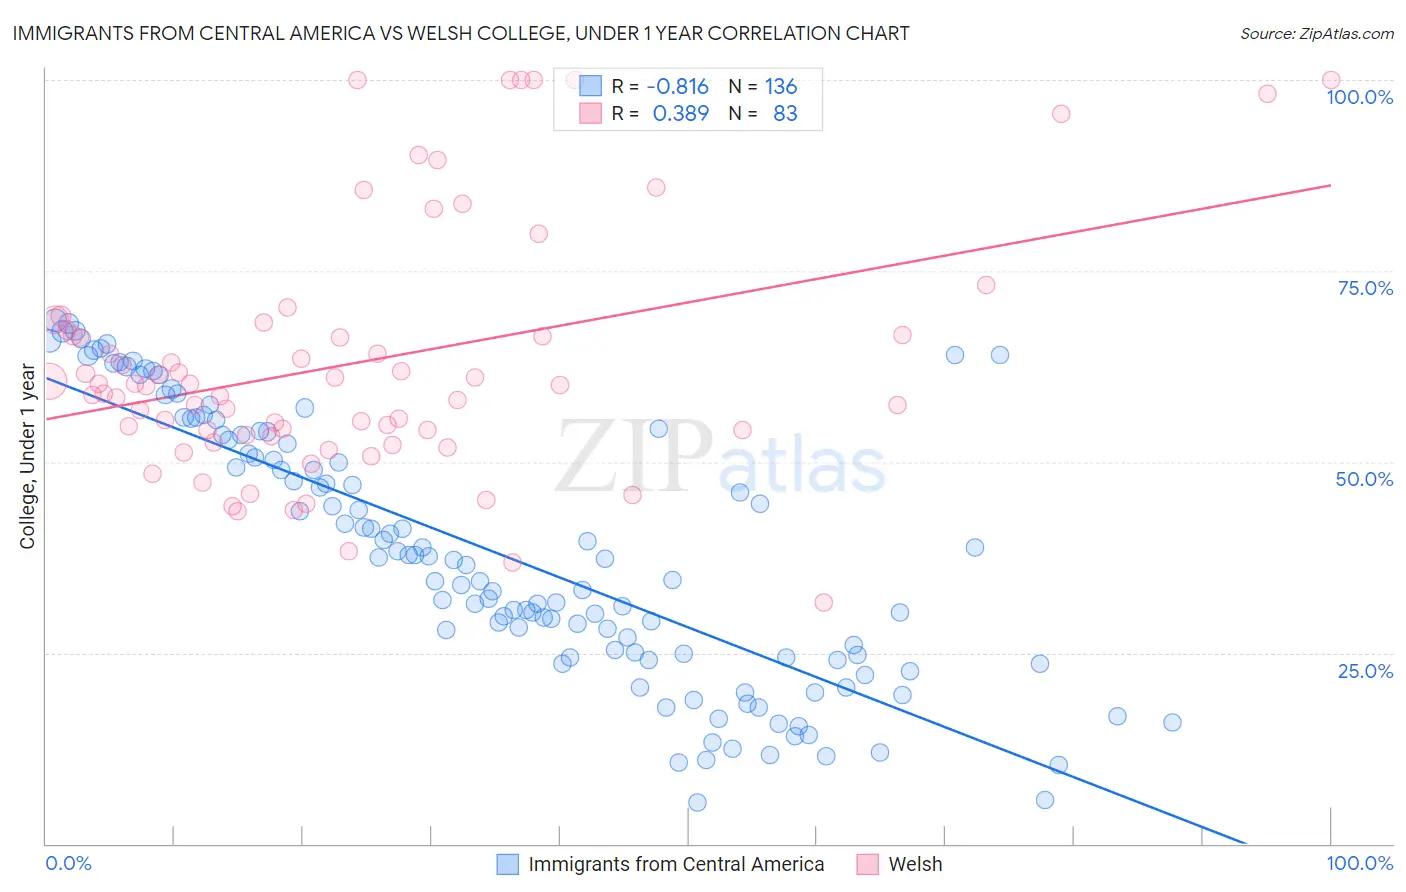
Immigrants from Central America vs Welsh College, Under 1 year Correlation Chart
The statistical analysis conducted on geographies consisting of 536,541,976 people shows a very strong negative correlation between the proportion of Immigrants from Central America and percentage of population with at least college, under 1 year education in the United States with a correlation coefficient (R) of -0.816 and weighted average of 54.4%. Similarly, the statistical analysis conducted on geographies consisting of 528,593,935 people shows a mild positive correlation between the proportion of Welsh and percentage of population with at least college, under 1 year education in the United States with a correlation coefficient (R) of 0.389 and weighted average of 66.0%, a difference of 21.3%.
College, Under 1 year Correlation Summary
| Measurement | Immigrants from Central America | Welsh |
| Minimum | 5.4% | 31.6% |
| Maximum | 68.5% | 100.0% |
| Range | 63.2% | 68.4% |
| Mean | 38.1% | 63.1% |
| Median | 37.3% | 60.0% |
| Interquartile 25% (IQ1) | 24.5% | 53.5% |
| Interquartile 75% (IQ3) | 53.5% | 67.2% |
| Interquartile Range (IQR) | 29.0% | 13.7% |
| Standard Deviation (Sample) | 17.1% | 16.3% |
| Standard Deviation (Population) | 17.0% | 16.2% |
Similar Demographics by College, Under 1 year
Demographics Similar to Immigrants from Central America by College, Under 1 year
In terms of college, under 1 year, the demographic groups most similar to Immigrants from Central America are Pennsylvania German (54.5%, a difference of 0.15%), Inupiat (54.6%, a difference of 0.32%), Lumbee (54.2%, a difference of 0.41%), Immigrants from the Azores (54.7%, a difference of 0.45%), and Immigrants from Dominican Republic (54.0%, a difference of 0.81%).
| Demographics | Rating | Rank | College, Under 1 year |
| Mexicans | 0.0 /100 | #330 | Tragic 55.6% |
| Dominicans | 0.0 /100 | #331 | Tragic 55.5% |
| Immigrants | Yemen | 0.0 /100 | #332 | Tragic 55.3% |
| Yuman | 0.0 /100 | #333 | Tragic 55.1% |
| Immigrants | Azores | 0.0 /100 | #334 | Tragic 54.7% |
| Inupiat | 0.0 /100 | #335 | Tragic 54.6% |
| Pennsylvania Germans | 0.0 /100 | #336 | Tragic 54.5% |
| Immigrants | Central America | 0.0 /100 | #337 | Tragic 54.4% |
| Lumbee | 0.0 /100 | #338 | Tragic 54.2% |
| Immigrants | Dominican Republic | 0.0 /100 | #339 | Tragic 54.0% |
| Spanish American Indians | 0.0 /100 | #340 | Tragic 54.0% |
| Immigrants | Cabo Verde | 0.0 /100 | #341 | Tragic 53.7% |
| Immigrants | Mexico | 0.0 /100 | #342 | Tragic 53.7% |
| Tohono O'odham | 0.0 /100 | #343 | Tragic 52.8% |
| Yakama | 0.0 /100 | #344 | Tragic 52.6% |
Demographics Similar to Welsh by College, Under 1 year
In terms of college, under 1 year, the demographic groups most similar to Welsh are Irish (66.0%, a difference of 0.020%), Sierra Leonean (66.0%, a difference of 0.10%), Immigrants from Eritrea (66.1%, a difference of 0.11%), Celtic (65.9%, a difference of 0.13%), and Tlingit-Haida (65.9%, a difference of 0.18%).
| Demographics | Rating | Rank | College, Under 1 year |
| Immigrants | Venezuela | 77.9 /100 | #149 | Good 66.3% |
| Immigrants | Iraq | 77.1 /100 | #150 | Good 66.3% |
| Immigrants | Sudan | 76.0 /100 | #151 | Good 66.2% |
| Sudanese | 74.1 /100 | #152 | Good 66.2% |
| Belgians | 73.7 /100 | #153 | Good 66.2% |
| Immigrants | Eritrea | 71.9 /100 | #154 | Good 66.1% |
| Irish | 70.3 /100 | #155 | Good 66.0% |
| Welsh | 69.9 /100 | #156 | Good 66.0% |
| Sierra Leoneans | 67.8 /100 | #157 | Good 66.0% |
| Celtics | 67.3 /100 | #158 | Good 65.9% |
| Tlingit-Haida | 66.4 /100 | #159 | Good 65.9% |
| Albanians | 66.1 /100 | #160 | Good 65.9% |
| Brazilians | 66.0 /100 | #161 | Good 65.9% |
| Koreans | 65.3 /100 | #162 | Good 65.9% |
| Somalis | 62.7 /100 | #163 | Good 65.8% |