Immigrants from Central America vs Immigrants from Cambodia College, Under 1 year
COMPARE
Immigrants from Central America
Immigrants from Cambodia
College, Under 1 year
College, Under 1 year Comparison
Immigrants from Central America
Immigrants from Cambodia
54.4%
COLLEGE, UNDER 1 YEAR
0.0/ 100
METRIC RATING
337th/ 347
METRIC RANK
61.5%
COLLEGE, UNDER 1 YEAR
0.4/ 100
METRIC RATING
254th/ 347
METRIC RANK
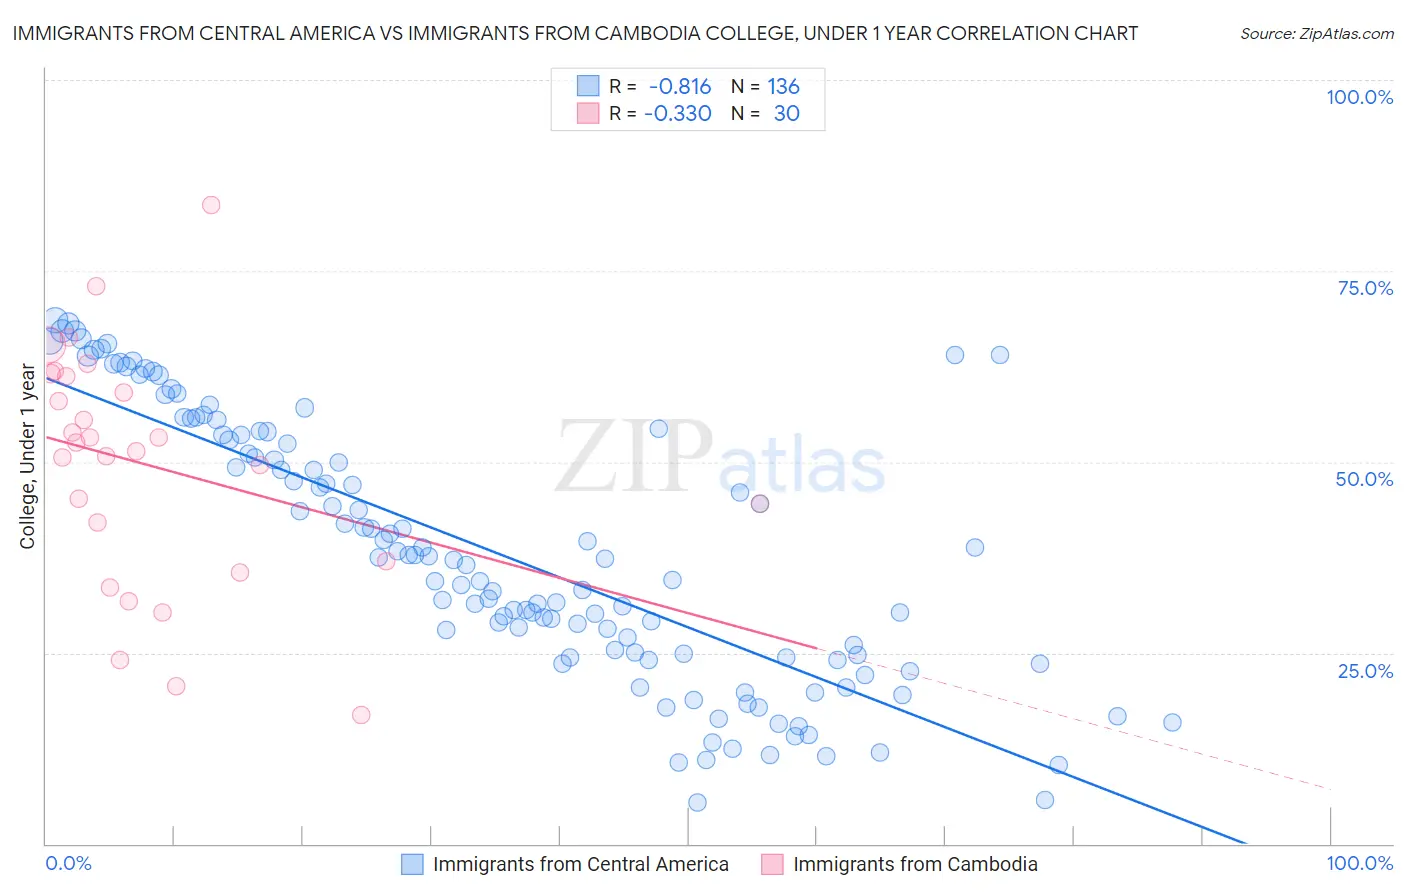
Immigrants from Central America vs Immigrants from Cambodia College, Under 1 year Correlation Chart
The statistical analysis conducted on geographies consisting of 536,541,976 people shows a very strong negative correlation between the proportion of Immigrants from Central America and percentage of population with at least college, under 1 year education in the United States with a correlation coefficient (R) of -0.816 and weighted average of 54.4%. Similarly, the statistical analysis conducted on geographies consisting of 205,153,442 people shows a mild negative correlation between the proportion of Immigrants from Cambodia and percentage of population with at least college, under 1 year education in the United States with a correlation coefficient (R) of -0.330 and weighted average of 61.5%, a difference of 12.9%.
College, Under 1 year Correlation Summary
| Measurement | Immigrants from Central America | Immigrants from Cambodia |
| Minimum | 5.4% | 16.8% |
| Maximum | 68.5% | 83.7% |
| Range | 63.2% | 66.8% |
| Mean | 38.1% | 49.5% |
| Median | 37.3% | 52.0% |
| Interquartile 25% (IQ1) | 24.5% | 36.9% |
| Interquartile 75% (IQ3) | 53.5% | 61.3% |
| Interquartile Range (IQR) | 29.0% | 24.4% |
| Standard Deviation (Sample) | 17.1% | 15.6% |
| Standard Deviation (Population) | 17.0% | 15.3% |
Similar Demographics by College, Under 1 year
Demographics Similar to Immigrants from Central America by College, Under 1 year
In terms of college, under 1 year, the demographic groups most similar to Immigrants from Central America are Pennsylvania German (54.5%, a difference of 0.15%), Inupiat (54.6%, a difference of 0.32%), Lumbee (54.2%, a difference of 0.41%), Immigrants from the Azores (54.7%, a difference of 0.45%), and Immigrants from Dominican Republic (54.0%, a difference of 0.81%).
| Demographics | Rating | Rank | College, Under 1 year |
| Mexicans | 0.0 /100 | #330 | Tragic 55.6% |
| Dominicans | 0.0 /100 | #331 | Tragic 55.5% |
| Immigrants | Yemen | 0.0 /100 | #332 | Tragic 55.3% |
| Yuman | 0.0 /100 | #333 | Tragic 55.1% |
| Immigrants | Azores | 0.0 /100 | #334 | Tragic 54.7% |
| Inupiat | 0.0 /100 | #335 | Tragic 54.6% |
| Pennsylvania Germans | 0.0 /100 | #336 | Tragic 54.5% |
| Immigrants | Central America | 0.0 /100 | #337 | Tragic 54.4% |
| Lumbee | 0.0 /100 | #338 | Tragic 54.2% |
| Immigrants | Dominican Republic | 0.0 /100 | #339 | Tragic 54.0% |
| Spanish American Indians | 0.0 /100 | #340 | Tragic 54.0% |
| Immigrants | Cabo Verde | 0.0 /100 | #341 | Tragic 53.7% |
| Immigrants | Mexico | 0.0 /100 | #342 | Tragic 53.7% |
| Tohono O'odham | 0.0 /100 | #343 | Tragic 52.8% |
| Yakama | 0.0 /100 | #344 | Tragic 52.6% |
Demographics Similar to Immigrants from Cambodia by College, Under 1 year
In terms of college, under 1 year, the demographic groups most similar to Immigrants from Cambodia are West Indian (61.5%, a difference of 0.0%), Japanese (61.5%, a difference of 0.0%), Immigrants from Micronesia (61.5%, a difference of 0.11%), Comanche (61.4%, a difference of 0.12%), and Bangladeshi (61.4%, a difference of 0.17%).
| Demographics | Rating | Rank | College, Under 1 year |
| Immigrants | Liberia | 0.8 /100 | #247 | Tragic 61.9% |
| Potawatomi | 0.6 /100 | #248 | Tragic 61.8% |
| Vietnamese | 0.5 /100 | #249 | Tragic 61.7% |
| Immigrants | Congo | 0.5 /100 | #250 | Tragic 61.7% |
| Immigrants | Micronesia | 0.5 /100 | #251 | Tragic 61.5% |
| West Indians | 0.4 /100 | #252 | Tragic 61.5% |
| Japanese | 0.4 /100 | #253 | Tragic 61.5% |
| Immigrants | Cambodia | 0.4 /100 | #254 | Tragic 61.5% |
| Comanche | 0.4 /100 | #255 | Tragic 61.4% |
| Bangladeshis | 0.4 /100 | #256 | Tragic 61.4% |
| Immigrants | Laos | 0.3 /100 | #257 | Tragic 61.3% |
| Immigrants | Bangladesh | 0.3 /100 | #258 | Tragic 61.3% |
| Indonesians | 0.3 /100 | #259 | Tragic 61.2% |
| Blackfeet | 0.3 /100 | #260 | Tragic 61.1% |
| Africans | 0.3 /100 | #261 | Tragic 61.1% |