Immigrants from Hungary vs Cheyenne College, Under 1 year

COMPARE

Immigrants from Hungary
Race
Ancestry
AfghanAfricanAlaska NativeAlaskan AthabascanAlbanianAleutAlsatianAmericanApacheArabArapahoArgentineanArmenianAssyrian/Chaldean/SyriacAustralianAustrianBahamianBangladeshiBarbadianBasqueBelgianBelizeanBermudanBhutaneseBlackfeetBolivianBrazilianBritishBritish West IndianBulgarianBurmeseCajunCambodianCanadianCape VerdeanCarpatho RusynCelticCentral AmericanCentral American IndianCherokeeChickasawChileanChineseChippewaChoctawColombianColvilleComancheCosta RicanCreeCreekCroatianCrowCubanCypriotCzechCzechoslovakianDanishDelawareDominicanDutchDutch West IndianEastern EuropeanEcuadorianEgyptianEnglishEstonianEthiopianEuropeanFijianFilipinoFinnishFrenchFrench American IndianFrench CanadianGermanGerman RussianGhanaianGreekGuamanian/ChamorroGuatemalanGuyaneseHaitianHmongHonduranHopiHoumaHungarianIcelanderIndian (Asian)IndonesianInupiatIranianIraqiIrishIroquoisIsraeliItalianJamaicanJapaneseJordanianKenyanKiowaKoreanLaotianLatvianLebaneseLiberianLithuanianLumbeeLuxembourgerMacedonianMalaysianMalteseMarshalleseMenomineeMexicanMexican American IndianMongolianMoroccanNative HawaiianNavajoNepaleseNew ZealanderNicaraguanNigerianNorthern EuropeanNorwegianOkinawanOsageOttawaPaiutePakistaniPalestinianPanamanianParaguayanPennsylvania GermanPeruvianPimaPolishPortuguesePotawatomiPuebloPuerto RicanPuget Sound SalishRomanianRussianSalvadoranSamoanScandinavianScotch-IrishScottishSeminoleSenegaleseSerbianShoshoneSierra LeoneanSiouxSlavicSlovakSloveneSomaliSouth AfricanSouth AmericanSouth American IndianSoviet UnionSpaniardSpanishSpanish AmericanSpanish American IndianSri LankanSubsaharan AfricanSudaneseSwedishSwissSyrianTaiwaneseThaiTlingit-HaidaTohono O'OdhamTonganTrinidadian and TobagonianTsimshianTurkishU.S. Virgin IslanderUgandanUkrainianUruguayanUteVenezuelanVietnameseWelshWest IndianYakamaYaquiYugoslavianYumanYup'ikZimbabwean
Immigration
NonimmigrantsImmigrantsAfghanistanAfricaAlbaniaArgentinaArmeniaAsiaAustraliaAustriaBahamasBangladeshBarbadosBelarusBelgiumBelizeBoliviaBosnia and HerzegovinaBrazilBulgariaBurma/MyanmarCabo VerdeCambodiaCameroonCanadaCaribbeanCentral AmericaChileChinaColombiaCongoCosta RicaCroatiaCubaCzechoslovakiaDenmarkDominicaDominican RepublicEastern AfricaEastern AsiaEastern EuropeEcuadorEgyptEl SalvadorEnglandEritreaEthiopiaEuropeFijiFranceGermanyGhanaGreeceGrenadaGuatemalaGuyanaHaitiHondurasHong KongHungaryIndiaIndonesiaIranIraqIrelandIsraelItalyJamaicaJapanJordanKazakhstanKenyaKoreaKuwaitLaosLatin AmericaLatviaLebanonLiberiaLithuaniaMalaysiaMexicoMicronesiaMiddle AfricaMoldovaMoroccoNepalNetherlandsNicaraguaNigeriaNorth AmericaNorth MacedoniaNorthern AfricaNorthern EuropeNorwayOceaniaPakistanPanamaPeruPhilippinesPolandPortugalRomaniaRussiaSaudi ArabiaScotlandSenegalSerbiaSierra LeoneSingaporeSomaliaSouth AfricaSouth AmericaSouth Central AsiaSouth Eastern AsiaSouthern EuropeSpainSri LankaSt. Vincent and the GrenadinesSudanSwedenSwitzerlandSyriaTaiwanThailandTrinidad and TobagoTurkeyUgandaUkraineUruguayUzbekistanVenezuelaVietnamWest IndiesWestern AfricaWestern AsiaWestern EuropeYemenZaireZimbabweAzores
Cheyenne
Race
Ancestry
AfghanAfricanAlaska NativeAlaskan AthabascanAlbanianAleutAlsatianAmericanApacheArabArapahoArgentineanArmenianAssyrian/Chaldean/SyriacAustralianAustrianBahamianBangladeshiBarbadianBasqueBelgianBelizeanBermudanBhutaneseBlackfeetBolivianBrazilianBritishBritish West IndianBulgarianBurmeseCajunCambodianCanadianCape VerdeanCarpatho RusynCelticCentral AmericanCentral American IndianCherokeeCheyenneChickasawChileanChineseChippewaChoctawColombianColvilleComancheCosta RicanCreeCreekCroatianCrowCubanCypriotCzechCzechoslovakianDanishDelawareDominicanDutchDutch West IndianEastern EuropeanEcuadorianEgyptianEnglishEstonianEthiopianEuropeanFijianFilipinoFinnishFrenchFrench American IndianFrench CanadianGermanGerman RussianGhanaianGreekGuamanian/ChamorroGuatemalanGuyaneseHaitianHmongHonduranHopiHoumaHungarianIcelanderIndian (Asian)IndonesianInupiatIranianIraqiIrishIroquoisIsraeliItalianJamaicanJapaneseJordanianKenyanKiowaKoreanLaotianLatvianLebaneseLiberianLithuanianLumbeeLuxembourgerMacedonianMalaysianMalteseMarshalleseMenomineeMexicanMexican American IndianMongolianMoroccanNative HawaiianNavajoNepaleseNew ZealanderNicaraguanNigerianNorthern EuropeanNorwegianOkinawanOsageOttawaPaiutePakistaniPalestinianPanamanianParaguayanPennsylvania GermanPeruvianPimaPolishPortuguesePotawatomiPuebloPuerto RicanPuget Sound SalishRomanianRussianSalvadoranSamoanScandinavianScotch-IrishScottishSeminoleSenegaleseSerbianShoshoneSierra LeoneanSiouxSlavicSlovakSloveneSomaliSouth AfricanSouth AmericanSouth American IndianSoviet UnionSpaniardSpanishSpanish AmericanSpanish American IndianSri LankanSubsaharan AfricanSudaneseSwedishSwissSyrianTaiwaneseThaiTlingit-HaidaTohono O'OdhamTonganTrinidadian and TobagonianTsimshianTurkishU.S. Virgin IslanderUgandanUkrainianUruguayanUteVenezuelanVietnameseWelshWest IndianYakamaYaquiYugoslavianYumanYup'ikZimbabwean
Immigration
NonimmigrantsImmigrantsAfghanistanAfricaAlbaniaArgentinaArmeniaAsiaAustraliaAustriaBahamasBangladeshBarbadosBelarusBelgiumBelizeBoliviaBosnia and HerzegovinaBrazilBulgariaBurma/MyanmarCabo VerdeCambodiaCameroonCanadaCaribbeanCentral AmericaChileChinaColombiaCongoCosta RicaCroatiaCubaCzechoslovakiaDenmarkDominicaDominican RepublicEastern AfricaEastern AsiaEastern EuropeEcuadorEgyptEl SalvadorEnglandEritreaEthiopiaEuropeFijiFranceGermanyGhanaGreeceGrenadaGuatemalaGuyanaHaitiHondurasHong KongIndiaIndonesiaIranIraqIrelandIsraelItalyJamaicaJapanJordanKazakhstanKenyaKoreaKuwaitLaosLatin AmericaLatviaLebanonLiberiaLithuaniaMalaysiaMexicoMicronesiaMiddle AfricaMoldovaMoroccoNepalNetherlandsNicaraguaNigeriaNorth AmericaNorth MacedoniaNorthern AfricaNorthern EuropeNorwayOceaniaPakistanPanamaPeruPhilippinesPolandPortugalRomaniaRussiaSaudi ArabiaScotlandSenegalSerbiaSierra LeoneSingaporeSomaliaSouth AfricaSouth AmericaSouth Central AsiaSouth Eastern AsiaSouthern EuropeSpainSri LankaSt. Vincent and the GrenadinesSudanSwedenSwitzerlandSyriaTaiwanThailandTrinidad and TobagoTurkeyUgandaUkraineUruguayUzbekistanVenezuelaVietnamWest IndiesWestern AfricaWestern AsiaWestern EuropeYemenZaireZimbabweAzores
College, Under 1 year
Income
Poverty
Unemployment
Labor Participation
Family Structure
Vehicle Availability
Education Level
Disability

College, Under 1 year Comparison

Immigrants from Hungary

Cheyenne

Exceptional
Tragic
68.3%
COLLEGE, UNDER 1 YEAR
98.3/ 100
METRIC RATING
84th/ 347
METRIC RANK
60.6%
COLLEGE, UNDER 1 YEAR
0.1/ 100
METRIC RATING
270th/ 347
METRIC RANK

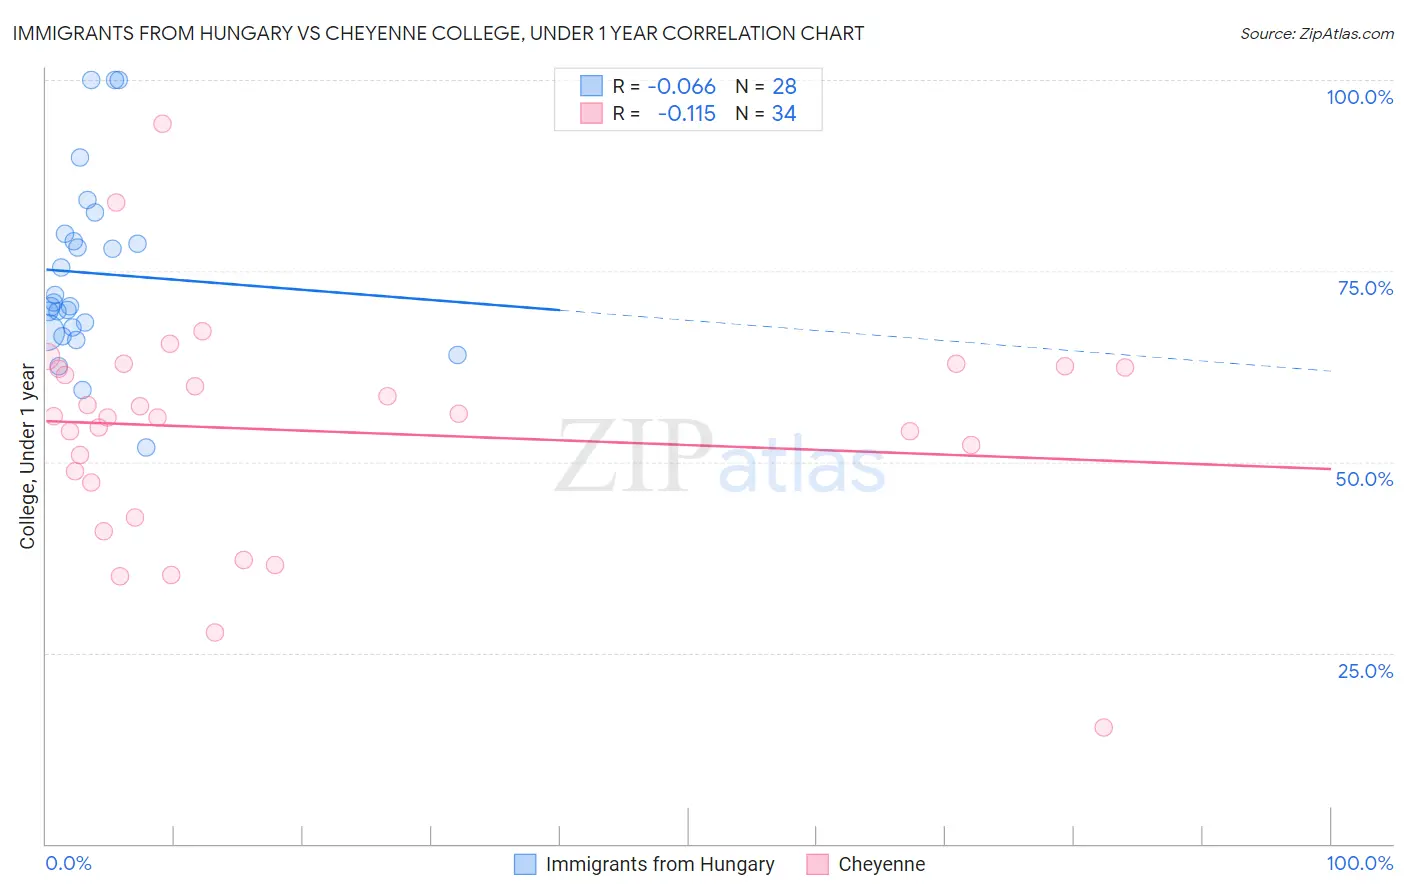
Immigrants from Hungary vs Cheyenne College, Under 1 year Correlation Chart

The statistical analysis conducted on geographies consisting of 195,707,305 people shows a slight negative correlation between the proportion of Immigrants from Hungary and percentage of population with at least college, under 1 year education in the United States with a correlation coefficient (R) of -0.066 and weighted average of 68.3%. Similarly, the statistical analysis conducted on geographies consisting of 80,719,411 people shows a poor negative correlation between the proportion of Cheyenne and percentage of population with at least college, under 1 year education in the United States with a correlation coefficient (R) of -0.115 and weighted average of 60.6%, a difference of 12.8%.
Immigrants from Hungary vs Cheyenne College, Under 1 year

College, Under 1 year Correlation Summary

MeasurementImmigrants from HungaryCheyenne
Minimum52.0%15.3%
Maximum100.0%94.3%
Range48.0%79.1%
Mean74.7%54.1%
Median70.7%55.9%
Interquartile 25% (IQ1)67.3%47.3%
Interquartile 75% (IQ3)79.3%62.4%
Interquartile Range (IQR)12.1%15.0%
Standard Deviation (Sample)11.9%14.9%
Standard Deviation (Population)11.7%14.7%

Similar Demographics by College, Under 1 year

Demographics Similar to Immigrants from Hungary by College, Under 1 year

In terms of college, under 1 year, the demographic groups most similar to Immigrants from Hungary are Egyptian (68.3%, a difference of 0.010%), Immigrants from Lebanon (68.3%, a difference of 0.010%), Argentinean (68.4%, a difference of 0.020%), Chinese (68.3%, a difference of 0.030%), and Norwegian (68.4%, a difference of 0.040%).
DemographicsRating | RankCollege, Under 1 year
British
98.6
/100
|
#77
Exceptional
68.5%
Danes
98.6
/100
|
#78
Exceptional
68.5%
Greeks
98.6
/100
|
#79
Exceptional
68.5%
Immigrants | Spain
98.5
/100
|
#80
Exceptional
68.4%
Immigrants | Greece
98.5
/100
|
#81
Exceptional
68.4%
Norwegians
98.4
/100
|
#82
Exceptional
68.4%
Argentineans
98.4
/100
|
#83
Exceptional
68.4%
Immigrants | Hungary
98.3
/100
|
#84
Exceptional
68.3%
Egyptians
98.3
/100
|
#85
Exceptional
68.3%
Immigrants | Lebanon
98.3
/100
|
#86
Exceptional
68.3%
Chinese
98.3
/100
|
#87
Exceptional
68.3%
Croatians
98.2
/100
|
#88
Exceptional
68.3%
Ethiopians
98.2
/100
|
#89
Exceptional
68.3%
Icelanders
98.1
/100
|
#90
Exceptional
68.3%
Europeans
98.1
/100
|
#91
Exceptional
68.2%

Demographics Similar to Cheyenne by College, Under 1 year

In terms of college, under 1 year, the demographic groups most similar to Cheyenne are U.S. Virgin Islander (60.6%, a difference of 0.020%), Immigrants from West Indies (60.6%, a difference of 0.11%), Jamaican (60.5%, a difference of 0.17%), Chickasaw (60.4%, a difference of 0.22%), and Alaska Native (60.4%, a difference of 0.22%).
DemographicsRating | RankCollege, Under 1 year
Shoshone
0.2
/100
|
#263
Tragic
61.1%
Trinidadians and Tobagonians
0.2
/100
|
#264
Tragic
61.1%
Immigrants | Bahamas
0.2
/100
|
#265
Tragic
61.1%
Alaskan Athabascans
0.2
/100
|
#266
Tragic
61.0%
Americans
0.2
/100
|
#267
Tragic
61.0%
Immigrants | Trinidad and Tobago
0.1
/100
|
#268
Tragic
60.7%
Immigrants | West Indies
0.1
/100
|
#269
Tragic
60.6%
Cheyenne
0.1
/100
|
#270
Tragic
60.6%
U.S. Virgin Islanders
0.1
/100
|
#271
Tragic
60.6%
Jamaicans
0.1
/100
|
#272
Tragic
60.5%
Chickasaw
0.1
/100
|
#273
Tragic
60.4%
Alaska Natives
0.1
/100
|
#274
Tragic
60.4%
Immigrants | Barbados
0.1
/100
|
#275
Tragic
60.4%
Arapaho
0.1
/100
|
#276
Tragic
60.3%
Bahamians
0.1
/100
|
#277
Tragic
60.3%