Liberian vs Cheyenne College, Under 1 year
COMPARE
Liberian
Cheyenne
College, Under 1 year
College, Under 1 year Comparison
Liberians
Cheyenne
63.0%
COLLEGE, UNDER 1 YEAR
3.2/ 100
METRIC RATING
229th/ 347
METRIC RANK
60.6%
COLLEGE, UNDER 1 YEAR
0.1/ 100
METRIC RATING
270th/ 347
METRIC RANK
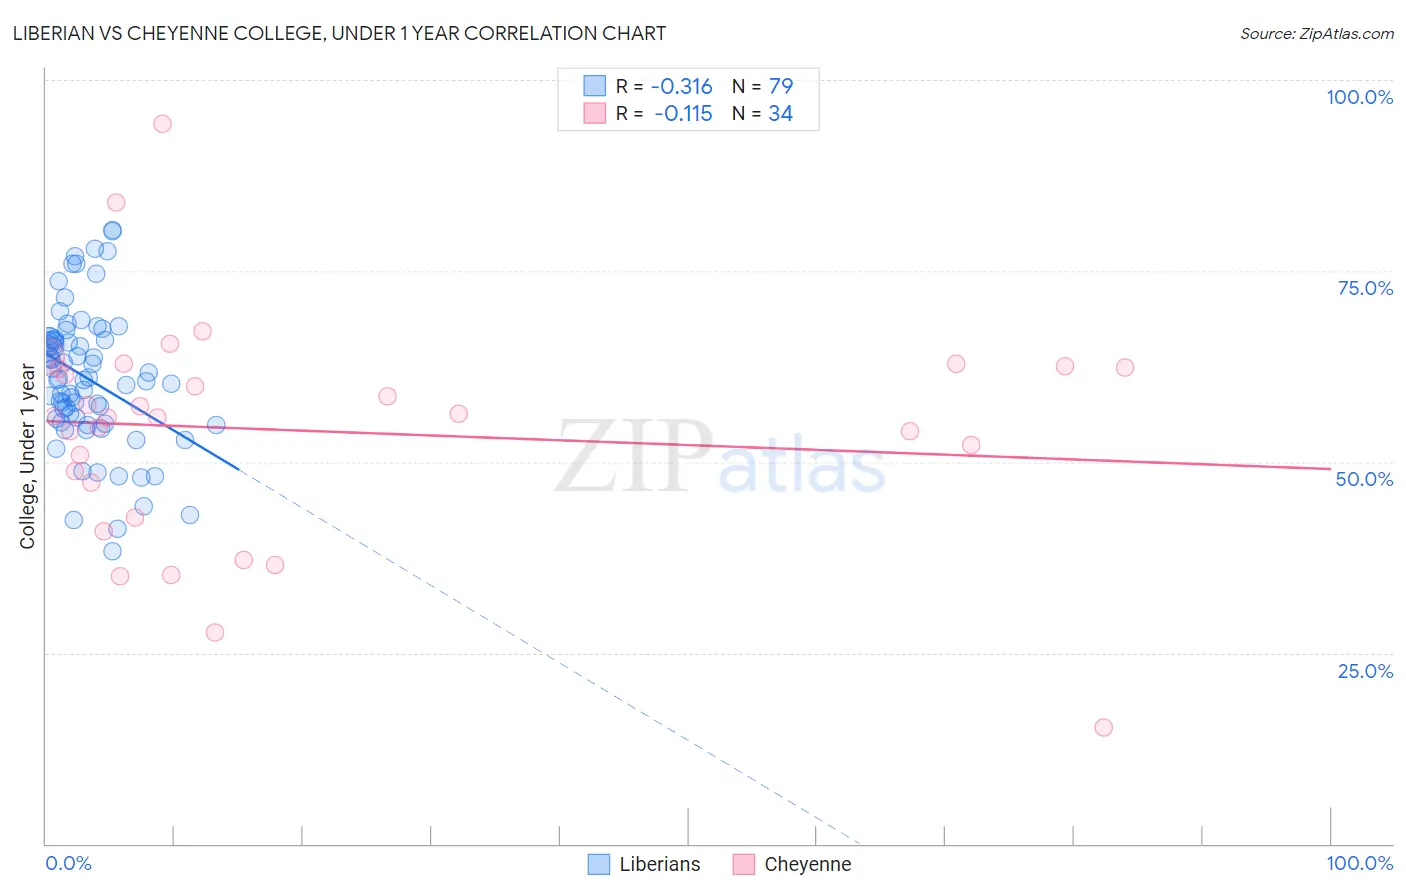
Liberian vs Cheyenne College, Under 1 year Correlation Chart
The statistical analysis conducted on geographies consisting of 118,090,659 people shows a mild negative correlation between the proportion of Liberians and percentage of population with at least college, under 1 year education in the United States with a correlation coefficient (R) of -0.316 and weighted average of 63.0%. Similarly, the statistical analysis conducted on geographies consisting of 80,719,411 people shows a poor negative correlation between the proportion of Cheyenne and percentage of population with at least college, under 1 year education in the United States with a correlation coefficient (R) of -0.115 and weighted average of 60.6%, a difference of 3.9%.
College, Under 1 year Correlation Summary
| Measurement | Liberian | Cheyenne |
| Minimum | 38.3% | 15.3% |
| Maximum | 80.3% | 94.3% |
| Range | 42.0% | 79.1% |
| Mean | 60.9% | 54.1% |
| Median | 60.8% | 55.9% |
| Interquartile 25% (IQ1) | 55.2% | 47.3% |
| Interquartile 75% (IQ3) | 66.0% | 62.4% |
| Interquartile Range (IQR) | 10.8% | 15.0% |
| Standard Deviation (Sample) | 9.1% | 14.9% |
| Standard Deviation (Population) | 9.0% | 14.7% |
Similar Demographics by College, Under 1 year
Demographics Similar to Liberians by College, Under 1 year
In terms of college, under 1 year, the demographic groups most similar to Liberians are Samoan (63.0%, a difference of 0.050%), Nonimmigrants (62.9%, a difference of 0.070%), Immigrants from Ghana (63.1%, a difference of 0.17%), Immigrants from Colombia (63.1%, a difference of 0.26%), and Immigrants from Peru (63.1%, a difference of 0.27%).
| Demographics | Rating | Rank | College, Under 1 year |
| Immigrants | Senegal | 5.0 /100 | #222 | Tragic 63.3% |
| Immigrants | Costa Rica | 4.5 /100 | #223 | Tragic 63.2% |
| Sub-Saharan Africans | 4.4 /100 | #224 | Tragic 63.2% |
| Immigrants | Peru | 4.0 /100 | #225 | Tragic 63.1% |
| Immigrants | Colombia | 4.0 /100 | #226 | Tragic 63.1% |
| Immigrants | Ghana | 3.7 /100 | #227 | Tragic 63.1% |
| Samoans | 3.3 /100 | #228 | Tragic 63.0% |
| Liberians | 3.2 /100 | #229 | Tragic 63.0% |
| Immigrants | Nonimmigrants | 3.0 /100 | #230 | Tragic 62.9% |
| Immigrants | Western Africa | 2.4 /100 | #231 | Tragic 62.8% |
| Osage | 2.2 /100 | #232 | Tragic 62.7% |
| Iroquois | 2.0 /100 | #233 | Tragic 62.6% |
| Chippewa | 2.0 /100 | #234 | Tragic 62.6% |
| Spanish Americans | 1.9 /100 | #235 | Tragic 62.6% |
| Immigrants | Immigrants | 1.7 /100 | #236 | Tragic 62.5% |
Demographics Similar to Cheyenne by College, Under 1 year
In terms of college, under 1 year, the demographic groups most similar to Cheyenne are U.S. Virgin Islander (60.6%, a difference of 0.020%), Immigrants from West Indies (60.6%, a difference of 0.11%), Jamaican (60.5%, a difference of 0.17%), Chickasaw (60.4%, a difference of 0.22%), and Alaska Native (60.4%, a difference of 0.22%).
| Demographics | Rating | Rank | College, Under 1 year |
| Shoshone | 0.2 /100 | #263 | Tragic 61.1% |
| Trinidadians and Tobagonians | 0.2 /100 | #264 | Tragic 61.1% |
| Immigrants | Bahamas | 0.2 /100 | #265 | Tragic 61.1% |
| Alaskan Athabascans | 0.2 /100 | #266 | Tragic 61.0% |
| Americans | 0.2 /100 | #267 | Tragic 61.0% |
| Immigrants | Trinidad and Tobago | 0.1 /100 | #268 | Tragic 60.7% |
| Immigrants | West Indies | 0.1 /100 | #269 | Tragic 60.6% |
| Cheyenne | 0.1 /100 | #270 | Tragic 60.6% |
| U.S. Virgin Islanders | 0.1 /100 | #271 | Tragic 60.6% |
| Jamaicans | 0.1 /100 | #272 | Tragic 60.5% |
| Chickasaw | 0.1 /100 | #273 | Tragic 60.4% |
| Alaska Natives | 0.1 /100 | #274 | Tragic 60.4% |
| Immigrants | Barbados | 0.1 /100 | #275 | Tragic 60.4% |
| Arapaho | 0.1 /100 | #276 | Tragic 60.3% |
| Bahamians | 0.1 /100 | #277 | Tragic 60.3% |