Immigrants from Caribbean vs Immigrants from Panama Householder Income Ages 25 - 44 years
COMPARE
Immigrants from Caribbean
Immigrants from Panama
Householder Income Ages 25 - 44 years
Householder Income Ages 25 - 44 years Comparison
Immigrants from Caribbean
Immigrants from Panama
$80,326
HOUSEHOLDER INCOME AGES 25 - 44 YEARS
0.0/ 100
METRIC RATING
304th/ 347
METRIC RANK
$89,451
HOUSEHOLDER INCOME AGES 25 - 44 YEARS
5.5/ 100
METRIC RATING
225th/ 347
METRIC RANK
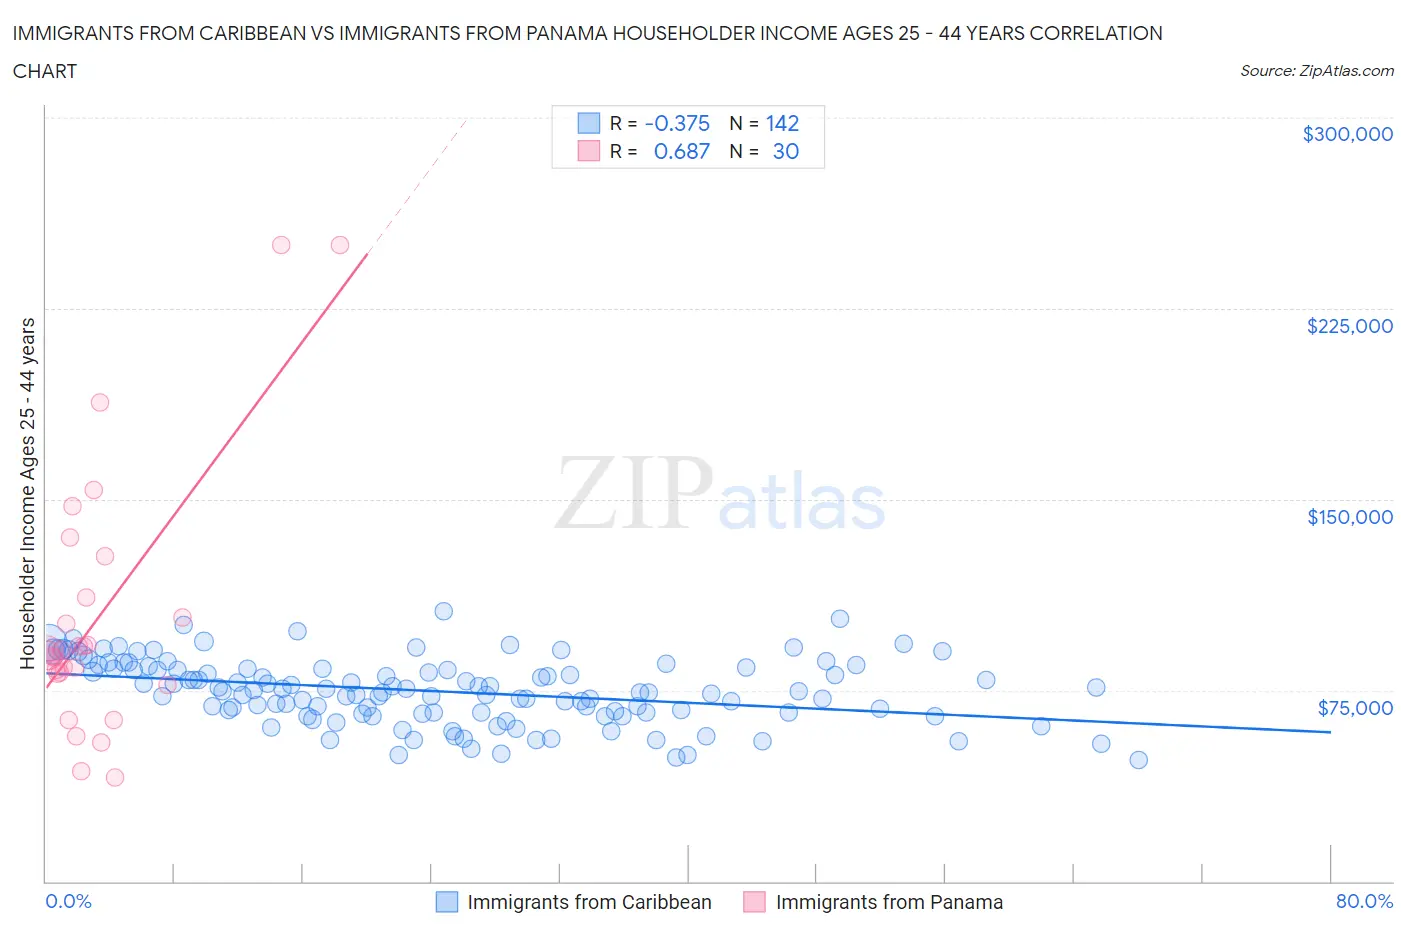
Immigrants from Caribbean vs Immigrants from Panama Householder Income Ages 25 - 44 years Correlation Chart
The statistical analysis conducted on geographies consisting of 448,247,507 people shows a mild negative correlation between the proportion of Immigrants from Caribbean and household income with householder between the ages 25 and 44 in the United States with a correlation coefficient (R) of -0.375 and weighted average of $80,326. Similarly, the statistical analysis conducted on geographies consisting of 221,047,816 people shows a significant positive correlation between the proportion of Immigrants from Panama and household income with householder between the ages 25 and 44 in the United States with a correlation coefficient (R) of 0.687 and weighted average of $89,451, a difference of 11.4%.
Householder Income Ages 25 - 44 years Correlation Summary
| Measurement | Immigrants from Caribbean | Immigrants from Panama |
| Minimum | $47,510 | $40,673 |
| Maximum | $105,938 | $250,001 |
| Range | $58,428 | $209,328 |
| Mean | $74,665 | $103,544 |
| Median | $74,621 | $90,149 |
| Interquartile 25% (IQ1) | $66,150 | $81,630 |
| Interquartile 75% (IQ3) | $83,625 | $111,639 |
| Interquartile Range (IQR) | $17,475 | $30,009 |
| Standard Deviation (Sample) | $12,546 | $51,093 |
| Standard Deviation (Population) | $12,502 | $50,234 |
Similar Demographics by Householder Income Ages 25 - 44 years
Demographics Similar to Immigrants from Caribbean by Householder Income Ages 25 - 44 years
In terms of householder income ages 25 - 44 years, the demographic groups most similar to Immigrants from Caribbean are Immigrants from Dominican Republic ($80,319, a difference of 0.010%), Apache ($80,260, a difference of 0.080%), Mexican ($80,427, a difference of 0.13%), Hispanic or Latino ($80,515, a difference of 0.24%), and Immigrants from Micronesia ($80,544, a difference of 0.27%).
| Demographics | Rating | Rank | Householder Income Ages 25 - 44 years |
| Immigrants | Guatemala | 0.1 /100 | #297 | Tragic $81,341 |
| Dominicans | 0.1 /100 | #298 | Tragic $81,229 |
| Immigrants | Liberia | 0.1 /100 | #299 | Tragic $80,863 |
| Cherokee | 0.0 /100 | #300 | Tragic $80,843 |
| Immigrants | Micronesia | 0.0 /100 | #301 | Tragic $80,544 |
| Hispanics or Latinos | 0.0 /100 | #302 | Tragic $80,515 |
| Mexicans | 0.0 /100 | #303 | Tragic $80,427 |
| Immigrants | Caribbean | 0.0 /100 | #304 | Tragic $80,326 |
| Immigrants | Dominican Republic | 0.0 /100 | #305 | Tragic $80,319 |
| Apache | 0.0 /100 | #306 | Tragic $80,260 |
| Haitians | 0.0 /100 | #307 | Tragic $80,055 |
| Immigrants | Central America | 0.0 /100 | #308 | Tragic $80,012 |
| Chippewa | 0.0 /100 | #309 | Tragic $80,005 |
| Fijians | 0.0 /100 | #310 | Tragic $79,956 |
| Indonesians | 0.0 /100 | #311 | Tragic $79,543 |
Demographics Similar to Immigrants from Panama by Householder Income Ages 25 - 44 years
In terms of householder income ages 25 - 44 years, the demographic groups most similar to Immigrants from Panama are Immigrants from Iraq ($89,444, a difference of 0.010%), Barbadian ($89,565, a difference of 0.13%), Immigrants from Guyana ($89,586, a difference of 0.15%), Immigrants from Ecuador ($89,673, a difference of 0.25%), and Immigrants from Trinidad and Tobago ($89,748, a difference of 0.33%).
| Demographics | Rating | Rank | Householder Income Ages 25 - 44 years |
| Guyanese | 7.1 /100 | #218 | Tragic $89,940 |
| Delaware | 6.9 /100 | #219 | Tragic $89,876 |
| Trinidadians and Tobagonians | 6.8 /100 | #220 | Tragic $89,856 |
| Immigrants | Trinidad and Tobago | 6.5 /100 | #221 | Tragic $89,748 |
| Immigrants | Ecuador | 6.2 /100 | #222 | Tragic $89,673 |
| Immigrants | Guyana | 5.9 /100 | #223 | Tragic $89,586 |
| Barbadians | 5.9 /100 | #224 | Tragic $89,565 |
| Immigrants | Panama | 5.5 /100 | #225 | Tragic $89,451 |
| Immigrants | Iraq | 5.5 /100 | #226 | Tragic $89,444 |
| Immigrants | St. Vincent and the Grenadines | 4.1 /100 | #227 | Tragic $88,888 |
| Immigrants | Bosnia and Herzegovina | 4.0 /100 | #228 | Tragic $88,819 |
| Immigrants | Barbados | 3.7 /100 | #229 | Tragic $88,687 |
| Alaskan Athabascans | 3.3 /100 | #230 | Tragic $88,446 |
| Immigrants | Grenada | 3.0 /100 | #231 | Tragic $88,311 |
| Immigrants | Nonimmigrants | 3.0 /100 | #232 | Tragic $88,301 |