Immigrants from Caribbean vs Argentinean GED/Equivalency
COMPARE
Immigrants from Caribbean
Argentinean
GED/Equivalency
GED/Equivalency Comparison
Immigrants from Caribbean
Argentineans
80.5%
GED/EQUIVALENCY
0.0/ 100
METRIC RATING
317th/ 347
METRIC RANK
86.7%
GED/EQUIVALENCY
89.7/ 100
METRIC RATING
127th/ 347
METRIC RANK
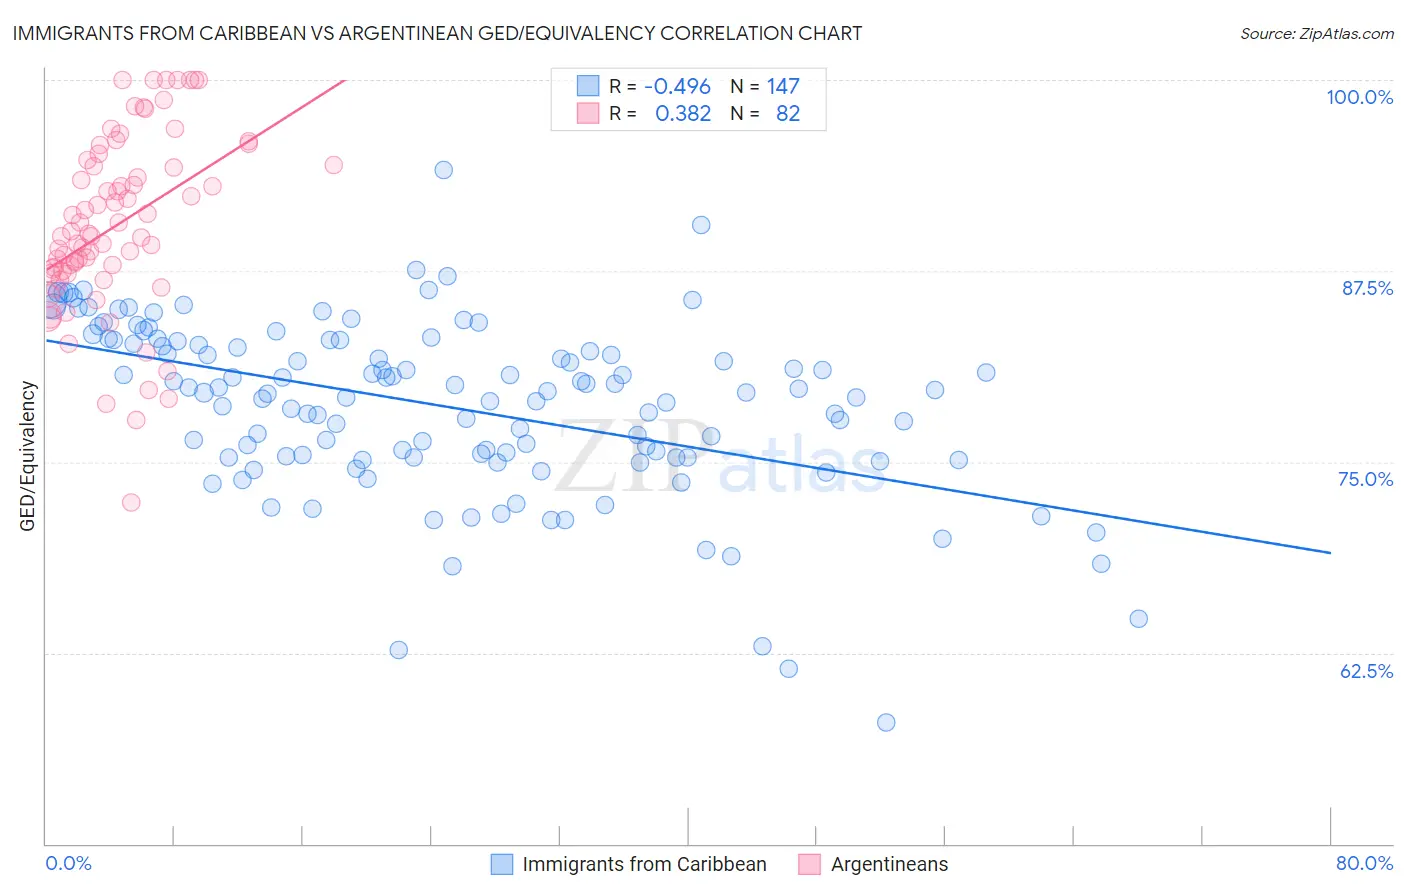
Immigrants from Caribbean vs Argentinean GED/Equivalency Correlation Chart
The statistical analysis conducted on geographies consisting of 450,064,654 people shows a moderate negative correlation between the proportion of Immigrants from Caribbean and percentage of population with at least ged/equivalency education in the United States with a correlation coefficient (R) of -0.496 and weighted average of 80.5%. Similarly, the statistical analysis conducted on geographies consisting of 297,143,432 people shows a mild positive correlation between the proportion of Argentineans and percentage of population with at least ged/equivalency education in the United States with a correlation coefficient (R) of 0.382 and weighted average of 86.7%, a difference of 7.7%.
GED/Equivalency Correlation Summary
| Measurement | Immigrants from Caribbean | Argentinean |
| Minimum | 58.0% | 72.4% |
| Maximum | 94.1% | 100.0% |
| Range | 36.2% | 27.6% |
| Mean | 78.7% | 90.5% |
| Median | 79.5% | 89.9% |
| Interquartile 25% (IQ1) | 75.3% | 87.5% |
| Interquartile 75% (IQ3) | 82.9% | 94.5% |
| Interquartile Range (IQR) | 7.6% | 7.0% |
| Standard Deviation (Sample) | 5.7% | 5.8% |
| Standard Deviation (Population) | 5.7% | 5.7% |
Similar Demographics by GED/Equivalency
Demographics Similar to Immigrants from Caribbean by GED/Equivalency
In terms of ged/equivalency, the demographic groups most similar to Immigrants from Caribbean are Yaqui (80.5%, a difference of 0.020%), Immigrants from Belize (80.5%, a difference of 0.020%), Central American Indian (80.6%, a difference of 0.10%), Apache (80.7%, a difference of 0.24%), and Immigrants from Cuba (80.2%, a difference of 0.43%).
| Demographics | Rating | Rank | GED/Equivalency |
| Immigrants | Guyana | 0.0 /100 | #310 | Tragic 81.0% |
| Natives/Alaskans | 0.0 /100 | #311 | Tragic 80.9% |
| Nicaraguans | 0.0 /100 | #312 | Tragic 80.9% |
| Cape Verdeans | 0.0 /100 | #313 | Tragic 80.9% |
| Belizeans | 0.0 /100 | #314 | Tragic 80.9% |
| Apache | 0.0 /100 | #315 | Tragic 80.7% |
| Central American Indians | 0.0 /100 | #316 | Tragic 80.6% |
| Immigrants | Caribbean | 0.0 /100 | #317 | Tragic 80.5% |
| Yaqui | 0.0 /100 | #318 | Tragic 80.5% |
| Immigrants | Belize | 0.0 /100 | #319 | Tragic 80.5% |
| Immigrants | Cuba | 0.0 /100 | #320 | Tragic 80.2% |
| Yup'ik | 0.0 /100 | #321 | Tragic 80.0% |
| Lumbee | 0.0 /100 | #322 | Tragic 80.0% |
| Immigrants | Nicaragua | 0.0 /100 | #323 | Tragic 79.9% |
| Mexican American Indians | 0.0 /100 | #324 | Tragic 79.4% |
Demographics Similar to Argentineans by GED/Equivalency
In terms of ged/equivalency, the demographic groups most similar to Argentineans are Yugoslavian (86.7%, a difference of 0.010%), Asian (86.7%, a difference of 0.030%), Immigrants from Egypt (86.7%, a difference of 0.040%), Celtic (86.7%, a difference of 0.040%), and Immigrants from Ukraine (86.7%, a difference of 0.040%).
| Demographics | Rating | Rank | GED/Equivalency |
| Scotch-Irish | 91.6 /100 | #120 | Exceptional 86.8% |
| Immigrants | Lebanon | 90.9 /100 | #121 | Exceptional 86.8% |
| Immigrants | Jordan | 90.8 /100 | #122 | Exceptional 86.8% |
| Immigrants | Italy | 90.5 /100 | #123 | Exceptional 86.7% |
| Immigrants | Egypt | 90.4 /100 | #124 | Exceptional 86.7% |
| Celtics | 90.4 /100 | #125 | Exceptional 86.7% |
| Asians | 90.3 /100 | #126 | Exceptional 86.7% |
| Argentineans | 89.7 /100 | #127 | Excellent 86.7% |
| Yugoslavians | 89.5 /100 | #128 | Excellent 86.7% |
| Immigrants | Ukraine | 88.9 /100 | #129 | Excellent 86.7% |
| Immigrants | Germany | 88.8 /100 | #130 | Excellent 86.7% |
| Immigrants | Spain | 88.5 /100 | #131 | Excellent 86.7% |
| Immigrants | Brazil | 88.4 /100 | #132 | Excellent 86.6% |
| Tsimshian | 88.3 /100 | #133 | Excellent 86.6% |
| Albanians | 87.7 /100 | #134 | Excellent 86.6% |